Data
83,909 items of data are available, covering 79,382 participants.
Defined-instances run from 2 to 3, labelled using Instancing
2.
Units of measurement are AU.
| Maximum | 0.00153503 |
| Decile 9 | 0.00120519 |
| Decile 8 | 0.00118048 |
| Decile 7 | 0.0011649 |
| Decile 6 | 0.00115287 |
| Median | 0.00114266 |
| Decile 4 | 0.00113309 |
| Decile 3 | 0.00112339 |
| Decile 2 | 0.00111261 |
| Decile 1 | 0.00109848 |
| Minimum | 0 |
|

|
- Mean = 0.00114798
- Std.dev = 4.77502e-05
- 27 items below graph minimum of 0.00099177
- 296 items above graph maximum of 0.0013119
|
2 Instances
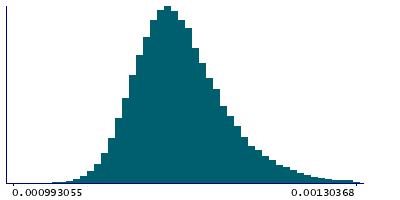
Instance 2 : Imaging visit (2014+)
79,151 participants, 79,151 items
| Maximum | 0.00153503 |
| Decile 9 | 0.00120595 |
| Decile 8 | 0.00118111 |
| Decile 7 | 0.0011655 |
| Decile 6 | 0.00115341 |
| Median | 0.00114313 |
| Decile 4 | 0.00113348 |
| Decile 3 | 0.00112375 |
| Decile 2 | 0.00111289 |
| Decile 1 | 0.00109863 |
| Minimum | 0 |
|
|
- Mean = 0.00114845
- Std.dev = 4.7833e-05
- 24 items below graph minimum of 0.000991312
- 276 items above graph maximum of 0.00131327
|
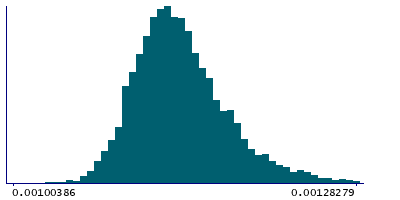
Instance 3 : First repeat imaging visit (2019+)
4,758 participants, 4,758 items
| Maximum | 0.00139548 |
| Decile 9 | 0.00118988 |
| Decile 8 | 0.00116871 |
| Decile 7 | 0.00115512 |
| Decile 6 | 0.00114431 |
| Median | 0.00113551 |
| Decile 4 | 0.00112706 |
| Decile 3 | 0.00111878 |
| Decile 2 | 0.00110909 |
| Decile 1 | 0.00109681 |
| Minimum | 0 |
|
|
- Mean = 0.00114016
- Std.dev = 4.56455e-05
- 3 items below graph minimum of 0.00100375
- 21 items above graph maximum of 0.00128294
|
Notes
Weighted-mean L1 in tract left anterior thalamic radiation (from dMRI data)
0 Related Data-Fields
There are no related data-fields
2 Applications
| Application ID | Title |
|---|
| 17689 | Genetic, environmental and lifestyle predictors of brain/cognitive-related outcomes. |
| 22783 | The joint analysis of imaging data and genetic data for early tumor detection, prevention, diagnosis and treatment |

