Data
83,909 items of data are available, covering 79,382 participants.
Defined-instances run from 2 to 3, labelled using Instancing
2.
Units of measurement are AU.
| Maximum | 0.00188419 |
| Decile 9 | 0.00130366 |
| Decile 8 | 0.00128145 |
| Decile 7 | 0.0012654 |
| Decile 6 | 0.00125172 |
| Median | 0.00123904 |
| Decile 4 | 0.00122611 |
| Decile 3 | 0.00121235 |
| Decile 2 | 0.00119603 |
| Decile 1 | 0.00117363 |
| Minimum | 0 |
|

|
- Mean = 0.00123848
- Std.dev = 5.57782e-05
- 50 items below graph minimum of 0.0010436
- 14 items above graph maximum of 0.00143369
|
2 Instances
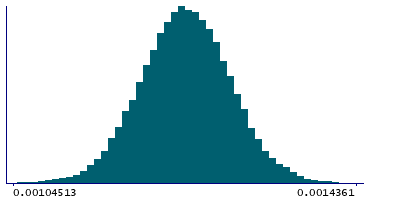
Instance 2 : Imaging visit (2014+)
79,151 participants, 79,151 items
| Maximum | 0.00188419 |
| Decile 9 | 0.00130369 |
| Decile 8 | 0.00128143 |
| Decile 7 | 0.00126528 |
| Decile 6 | 0.00125155 |
| Median | 0.00123882 |
| Decile 4 | 0.00122595 |
| Decile 3 | 0.00121207 |
| Decile 2 | 0.00119569 |
| Decile 1 | 0.00117324 |
| Minimum | 0 |
|
|
- Mean = 0.00123832
- Std.dev = 5.56968e-05
- 47 items below graph minimum of 0.00104278
- 13 items above graph maximum of 0.00143414
|
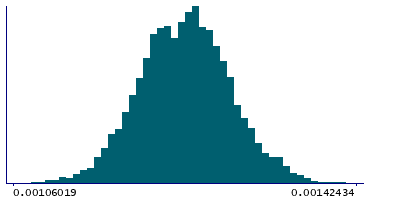
Instance 3 : First repeat imaging visit (2019+)
4,758 participants, 4,758 items
| Maximum | 0.00142469 |
| Decile 9 | 0.00130302 |
| Decile 8 | 0.0012816 |
| Decile 7 | 0.00126694 |
| Decile 6 | 0.0012543 |
| Median | 0.0012426 |
| Decile 4 | 0.00122919 |
| Decile 3 | 0.00121584 |
| Decile 2 | 0.00120199 |
| Decile 1 | 0.00118154 |
| Minimum | 0 |
|
|
- Mean = 0.00124121
- Std.dev = 5.70468e-05
- 3 items below graph minimum of 0.00106006
- 1 item above graph maximum of 0.00142451
|
Notes
Weighted-mean L1 in tract right cingulate gyrus part of cingulum (from dMRI data)
0 Related Data-Fields
There are no related data-fields
2 Applications
| Application ID | Title |
|---|
| 17689 | Genetic, environmental and lifestyle predictors of brain/cognitive-related outcomes. |
| 22783 | The joint analysis of imaging data and genetic data for early tumor detection, prevention, diagnosis and treatment |

