Data
83,909 items of data are available, covering 79,382 participants.
Defined-instances run from 2 to 3, labelled using Instancing
2.
Units of measurement are AU.
| Maximum | 0.00157782 |
| Decile 9 | 0.00135946 |
| Decile 8 | 0.00134168 |
| Decile 7 | 0.00132908 |
| Decile 6 | 0.00131816 |
| Median | 0.0013081 |
| Decile 4 | 0.00129811 |
| Decile 3 | 0.00128747 |
| Decile 2 | 0.00127488 |
| Decile 1 | 0.00125736 |
| Minimum | 0 |
|
|
- Mean = 0.00130803
- Std.dev = 4.69862e-05
- 39 items below graph minimum of 0.00115527
- 28 items above graph maximum of 0.00146156
|
2 Instances
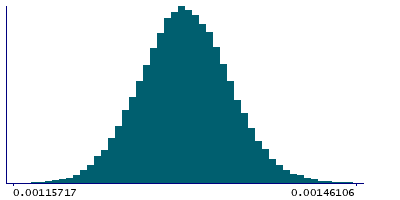
Instance 2 : Imaging visit (2014+)
79,151 participants, 79,151 items
| Maximum | 0.00157782 |
| Decile 9 | 0.00135982 |
| Decile 8 | 0.00134199 |
| Decile 7 | 0.00132936 |
| Decile 6 | 0.0013184 |
| Median | 0.00130834 |
| Decile 4 | 0.00129836 |
| Decile 3 | 0.00128774 |
| Decile 2 | 0.0012751 |
| Decile 1 | 0.00125748 |
| Minimum | 0 |
|
|
- Mean = 0.00130829
- Std.dev = 4.67367e-05
- 36 items below graph minimum of 0.00115514
- 25 items above graph maximum of 0.00146215
|
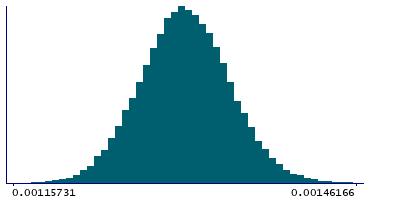
Instance 3 : First repeat imaging visit (2019+)
4,758 participants, 4,758 items
| Maximum | 0.00148748 |
| Decile 9 | 0.00135337 |
| Decile 8 | 0.00133677 |
| Decile 7 | 0.00132485 |
| Decile 6 | 0.00131385 |
| Median | 0.00130418 |
| Decile 4 | 0.00129436 |
| Decile 3 | 0.0012846 |
| Decile 2 | 0.00127213 |
| Decile 1 | 0.0012551 |
| Minimum | 0 |
|

|
- Mean = 0.00130374
- Std.dev = 5.07649e-05
- 3 items below graph minimum of 0.00115683
- 1 item above graph maximum of 0.00145164
|
Notes
Weighted-mean L1 in tract left corticospinal tract (from dMRI data)
0 Related Data-Fields
There are no related data-fields
2 Applications
| Application ID | Title |
|---|
| 17689 | Genetic, environmental and lifestyle predictors of brain/cognitive-related outcomes. |
| 22783 | The joint analysis of imaging data and genetic data for early tumor detection, prevention, diagnosis and treatment |

