Data
83,909 items of data are available, covering 79,382 participants.
Defined-instances run from 2 to 3, labelled using Instancing
2.
Units of measurement are AU.
| Maximum | 0.00157102 |
| Decile 9 | 0.00133235 |
| Decile 8 | 0.00131208 |
| Decile 7 | 0.00129818 |
| Decile 6 | 0.00128698 |
| Median | 0.00127663 |
| Decile 4 | 0.00126643 |
| Decile 3 | 0.00125608 |
| Decile 2 | 0.00124422 |
| Decile 1 | 0.00122796 |
| Minimum | 0 |
|
|
- Mean = 0.00127846
- Std.dev = 4.66459e-05
- 31 items below graph minimum of 0.00112357
- 107 items above graph maximum of 0.00143674
|
2 Instances
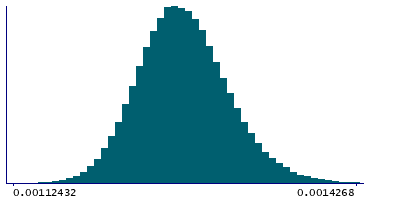
Instance 2 : Imaging visit (2014+)
79,151 participants, 79,151 items
| Maximum | 0.00157102 |
| Decile 9 | 0.00133325 |
| Decile 8 | 0.00131302 |
| Decile 7 | 0.00129914 |
| Decile 6 | 0.00128784 |
| Median | 0.00127754 |
| Decile 4 | 0.00126737 |
| Decile 3 | 0.00125693 |
| Decile 2 | 0.001245 |
| Decile 1 | 0.00122865 |
| Minimum | 0 |
|

|
- Mean = 0.00127933
- Std.dev = 4.65658e-05
- 29 items below graph minimum of 0.00112405
- 101 items above graph maximum of 0.00143785
|
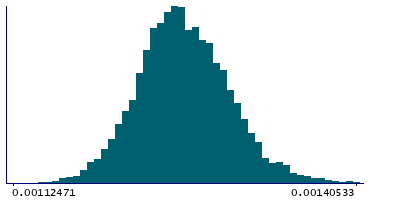
Instance 3 : First repeat imaging visit (2019+)
4,758 participants, 4,758 items
| Maximum | 0.00145475 |
| Decile 9 | 0.00131181 |
| Decile 8 | 0.00129493 |
| Decile 7 | 0.00128272 |
| Decile 6 | 0.00127211 |
| Median | 0.0012623 |
| Decile 4 | 0.00125344 |
| Decile 3 | 0.00124403 |
| Decile 2 | 0.00123392 |
| Decile 1 | 0.00121826 |
| Minimum | 0 |
|
|
- Mean = 0.0012639
- Std.dev = 4.5554e-05
- 2 items below graph minimum of 0.00112472
- 5 items above graph maximum of 0.00140536
|
Notes
Weighted-mean L1 in tract right inferior fronto-occipital fasciculus (from dMRI data)
0 Related Data-Fields
There are no related data-fields
2 Applications
| Application ID | Title |
|---|
| 17689 | Genetic, environmental and lifestyle predictors of brain/cognitive-related outcomes. |
| 22783 | The joint analysis of imaging data and genetic data for early tumor detection, prevention, diagnosis and treatment |

