Data
83,909 items of data are available, covering 79,382 participants.
Defined-instances run from 2 to 3, labelled using Instancing
2.
Units of measurement are AU.
| Maximum | 0.00160555 |
| Decile 9 | 0.00132043 |
| Decile 8 | 0.00130096 |
| Decile 7 | 0.00128812 |
| Decile 6 | 0.00127763 |
| Median | 0.00126804 |
| Decile 4 | 0.00125875 |
| Decile 3 | 0.00124889 |
| Decile 2 | 0.00123761 |
| Decile 1 | 0.00122166 |
| Minimum | 0 |
|

|
- Mean = 0.0012698
- Std.dev = 4.24013e-05
- 30 items below graph minimum of 0.0011229
- 150 items above graph maximum of 0.00141919
|
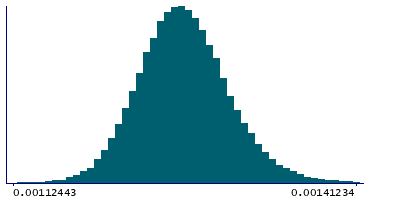
2 Instances
Instance 2 : Imaging visit (2014+)
79,151 participants, 79,151 items
| Maximum | 0.00160555 |
| Decile 9 | 0.00132136 |
| Decile 8 | 0.0013018 |
| Decile 7 | 0.00128906 |
| Decile 6 | 0.00127856 |
| Median | 0.001269 |
| Decile 4 | 0.00125967 |
| Decile 3 | 0.00124983 |
| Decile 2 | 0.00123852 |
| Decile 1 | 0.00122259 |
| Minimum | 0 |
|
|
- Mean = 0.00127073
- Std.dev = 4.23139e-05
- 29 items below graph minimum of 0.00112383
- 140 items above graph maximum of 0.00142012
|
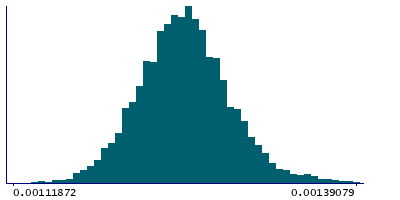
Instance 3 : First repeat imaging visit (2019+)
4,758 participants, 4,758 items
| Maximum | 0.00143698 |
| Decile 9 | 0.00130017 |
| Decile 8 | 0.00128273 |
| Decile 7 | 0.00127121 |
| Decile 6 | 0.00126204 |
| Median | 0.00125361 |
| Decile 4 | 0.0012449 |
| Decile 3 | 0.00123584 |
| Decile 2 | 0.00122461 |
| Decile 1 | 0.00120944 |
| Minimum | 0 |
|
|
- Mean = 0.00125426
- Std.dev = 4.0807e-05
- 1 item below graph minimum of 0.0011187
- 6 items above graph maximum of 0.00139091
|
Notes
Weighted-mean L1 in tract right inferior longitudinal fasciculus (from dMRI data)
0 Related Data-Fields
There are no related data-fields
2 Applications
| Application ID | Title |
|---|
| 17689 | Genetic, environmental and lifestyle predictors of brain/cognitive-related outcomes. |
| 22783 | The joint analysis of imaging data and genetic data for early tumor detection, prevention, diagnosis and treatment |

