Data
83,909 items of data are available, covering 79,382 participants.
Defined-instances run from 2 to 3, labelled using Instancing
2.
Units of measurement are AU.
| Maximum | 0.00186295 |
| Decile 9 | 0.00135954 |
| Decile 8 | 0.001331 |
| Decile 7 | 0.0013127 |
| Decile 6 | 0.00129853 |
| Median | 0.00128655 |
| Decile 4 | 0.00127514 |
| Decile 3 | 0.00126312 |
| Decile 2 | 0.00124998 |
| Decile 1 | 0.00123229 |
| Minimum | 0 |
|

|
- Mean = 0.00129253
- Std.dev = 5.7709e-05
- 26 items below graph minimum of 0.00110504
- 474 items above graph maximum of 0.00148679
|
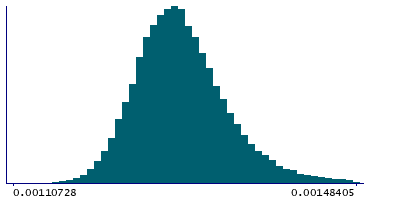
2 Instances
Instance 2 : Imaging visit (2014+)
79,151 participants, 79,151 items
| Maximum | 0.00186295 |
| Decile 9 | 0.00136045 |
| Decile 8 | 0.0013319 |
| Decile 7 | 0.00131365 |
| Decile 6 | 0.00129948 |
| Median | 0.00128739 |
| Decile 4 | 0.00127595 |
| Decile 3 | 0.0012639 |
| Decile 2 | 0.00125077 |
| Decile 1 | 0.00123285 |
| Minimum | 0 |
|
|
- Mean = 0.00129337
- Std.dev = 5.77167e-05
- 24 items below graph minimum of 0.00110525
- 447 items above graph maximum of 0.00148806
|
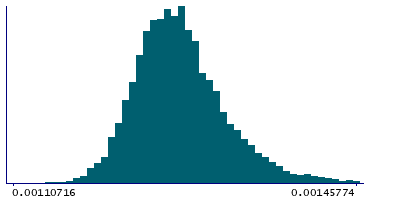
Instance 3 : First repeat imaging visit (2019+)
4,758 participants, 4,758 items
| Maximum | 0.00163506 |
| Decile 9 | 0.00134093 |
| Decile 8 | 0.00131339 |
| Decile 7 | 0.00129618 |
| Decile 6 | 0.00128391 |
| Median | 0.00127321 |
| Decile 4 | 0.00126252 |
| Decile 3 | 0.0012517 |
| Decile 2 | 0.00124022 |
| Decile 1 | 0.00122402 |
| Minimum | 0 |
|
|
- Mean = 0.00127858
- Std.dev = 5.5759e-05
- 2 items below graph minimum of 0.00110711
- 32 items above graph maximum of 0.00145784
|
Notes
Weighted-mean L1 in tract left posterior thalamic radiation (from dMRI data)
0 Related Data-Fields
There are no related data-fields
2 Applications
| Application ID | Title |
|---|
| 17689 | Genetic, environmental and lifestyle predictors of brain/cognitive-related outcomes. |
| 22783 | The joint analysis of imaging data and genetic data for early tumor detection, prevention, diagnosis and treatment |

