Data
83,909 items of data are available, covering 79,382 participants.
Defined-instances run from 2 to 3, labelled using Instancing
2.
Units of measurement are AU.
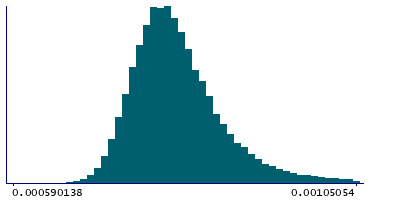
| Maximum | 0.00269733 |
| Decile 9 | 0.000904254 |
| Decile 8 | 0.000861562 |
| Decile 7 | 0.000837655 |
| Decile 6 | 0.000819805 |
| Median | 0.000804965 |
| Decile 4 | 0.000791415 |
| Decile 3 | 0.000777955 |
| Decile 2 | 0.000763388 |
| Decile 1 | 0.000744219 |
| Minimum | 0 |
|
|
- Mean = 0.00081825
- Std.dev = 7.61756e-05
- 21 items below graph minimum of 0.000584185
- 1125 items above graph maximum of 0.00106429
|
2 Instances
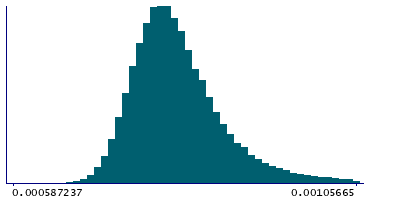
Instance 2 : Imaging visit (2014+)
79,151 participants, 79,151 items
| Maximum | 0.00269733 |
| Decile 9 | 0.000905293 |
| Decile 8 | 0.000862456 |
| Decile 7 | 0.000838355 |
| Decile 6 | 0.000820399 |
| Median | 0.000805477 |
| Decile 4 | 0.000791883 |
| Decile 3 | 0.000778273 |
| Decile 2 | 0.000763732 |
| Decile 1 | 0.000744495 |
| Minimum | 0 |
|
|
- Mean = 0.000818904
- Std.dev = 7.65758e-05
- 19 items below graph minimum of 0.000583697
- 1063 items above graph maximum of 0.00106609
|
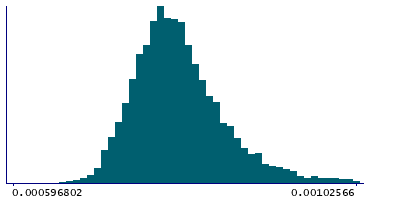
Instance 3 : First repeat imaging visit (2019+)
4,758 participants, 4,758 items
| Maximum | 0.00142351 |
| Decile 9 | 0.000882726 |
| Decile 8 | 0.000847288 |
| Decile 7 | 0.000825392 |
| Decile 6 | 0.000809919 |
| Median | 0.000797155 |
| Decile 4 | 0.000784622 |
| Decile 3 | 0.000772379 |
| Decile 2 | 0.000758077 |
| Decile 1 | 0.000739765 |
| Minimum | 0 |
|
|
- Mean = 0.000807357
- Std.dev = 6.82653e-05
- 2 items below graph minimum of 0.000596804
- 66 items above graph maximum of 0.00102569
|
Notes
Weighted-mean L2 in tract left parahippocampal part of cingulum (from dMRI data)
0 Related Data-Fields
There are no related data-fields
2 Applications
| Application ID | Title |
|---|
| 17689 | Genetic, environmental and lifestyle predictors of brain/cognitive-related outcomes. |
| 22783 | The joint analysis of imaging data and genetic data for early tumor detection, prevention, diagnosis and treatment |

