Data
83,909 items of data are available, covering 79,382 participants.
Defined-instances run from 2 to 3, labelled using Instancing
2.
Units of measurement are AU.
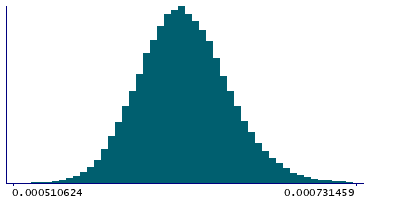
| Maximum | 0.00126835 |
| Decile 9 | 0.000658455 |
| Decile 8 | 0.000644366 |
| Decile 7 | 0.000634899 |
| Decile 6 | 0.000626961 |
| Median | 0.000619637 |
| Decile 4 | 0.000612598 |
| Decile 3 | 0.000605064 |
| Decile 2 | 0.00059636 |
| Decile 1 | 0.000584439 |
| Minimum | 0 |
|
|
- Mean = 0.000620743
- Std.dev = 3.17679e-05
- 33 items below graph minimum of 0.000510422
- 126 items above graph maximum of 0.000732472
|
2 Instances
Instance 2 : Imaging visit (2014+)
79,151 participants, 79,151 items
| Maximum | 0.00126835 |
| Decile 9 | 0.000658643 |
| Decile 8 | 0.000644434 |
| Decile 7 | 0.00063492 |
| Decile 6 | 0.000626988 |
| Median | 0.000619674 |
| Decile 4 | 0.00061263 |
| Decile 3 | 0.000605055 |
| Decile 2 | 0.00059636 |
| Decile 1 | 0.000584419 |
| Minimum | 0 |
|

|
- Mean = 0.000620802
- Std.dev = 3.17337e-05
- 30 items below graph minimum of 0.000510195
- 115 items above graph maximum of 0.000732866
|
Instance 3 : First repeat imaging visit (2019+)
4,758 participants, 4,758 items
| Maximum | 0.00081721 |
| Decile 9 | 0.000655333 |
| Decile 8 | 0.00064342 |
| Decile 7 | 0.000634594 |
| Decile 6 | 0.000626504 |
| Median | 0.000619157 |
| Decile 4 | 0.000612163 |
| Decile 3 | 0.000605162 |
| Decile 2 | 0.000596366 |
| Decile 1 | 0.000584637 |
| Minimum | 0 |
|

|
- Mean = 0.000619749
- Std.dev = 3.23144e-05
- 3 items below graph minimum of 0.000513942
- 9 items above graph maximum of 0.000726028
|
Notes
Weighted-mean L2 in tract right corticospinal tract (from dMRI data)
0 Related Data-Fields
There are no related data-fields
2 Applications
| Application ID | Title |
|---|
| 17689 | Genetic, environmental and lifestyle predictors of brain/cognitive-related outcomes. |
| 22783 | The joint analysis of imaging data and genetic data for early tumor detection, prevention, diagnosis and treatment |

