Data
83,909 items of data are available, covering 79,382 participants.
Defined-instances run from 2 to 3, labelled using Instancing
2.
Units of measurement are AU.
| Maximum | 0.00122216 |
| Decile 9 | 0.000476115 |
| Decile 8 | 0.000460534 |
| Decile 7 | 0.000449568 |
| Decile 6 | 0.000440617 |
| Median | 0.0004322 |
| Decile 4 | 0.000423832 |
| Decile 3 | 0.000415015 |
| Decile 2 | 0.000404764 |
| Decile 1 | 0.000390598 |
| Minimum | 0 |
|

|
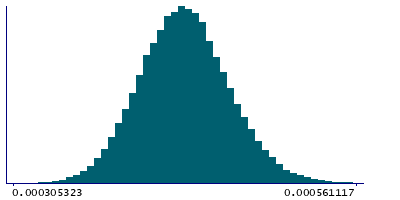
- Mean = 0.000432849
- Std.dev = 3.46568e-05
- 31 items below graph minimum of 0.000305081
- 49 items above graph maximum of 0.000561631
|
2 Instances
Instance 2 : Imaging visit (2014+)
79,151 participants, 79,151 items
| Maximum | 0.00122216 |
| Decile 9 | 0.000476222 |
| Decile 8 | 0.000460613 |
| Decile 7 | 0.000449621 |
| Decile 6 | 0.000440651 |
| Median | 0.000432219 |
| Decile 4 | 0.000423843 |
| Decile 3 | 0.000414982 |
| Decile 2 | 0.000404706 |
| Decile 1 | 0.000390462 |
| Minimum | 0 |
|
|
- Mean = 0.000432869
- Std.dev = 3.47218e-05
- 27 items below graph minimum of 0.000304701
- 47 items above graph maximum of 0.000561982
|
Instance 3 : First repeat imaging visit (2019+)
4,758 participants, 4,758 items
| Maximum | 0.000563956 |
| Decile 9 | 0.000473873 |
| Decile 8 | 0.000459096 |
| Decile 7 | 0.000448615 |
| Decile 6 | 0.000439931 |
| Median | 0.000431879 |
| Decile 4 | 0.000423619 |
| Decile 3 | 0.000415515 |
| Decile 2 | 0.000405894 |
| Decile 1 | 0.00039238 |
| Minimum | 0 |
|

|
- Mean = 0.000432526
- Std.dev = 3.35562e-05
- 3 items below graph minimum of 0.000310887
- 1 item above graph maximum of 0.000555366
|
Notes
Weighted-mean L3 in tract right cingulate gyrus part of cingulum (from dMRI data)
0 Related Data-Fields
There are no related data-fields
2 Applications
| Application ID | Title |
|---|
| 17689 | Genetic, environmental and lifestyle predictors of brain/cognitive-related outcomes. |
| 22783 | The joint analysis of imaging data and genetic data for early tumor detection, prevention, diagnosis and treatment |

