Data
83,909 items of data are available, covering 79,382 participants.
Defined-instances run from 2 to 3, labelled using Instancing
2.
Units of measurement are AU.
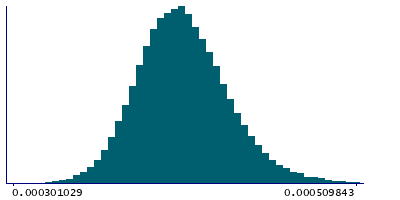
| Maximum | 0.000699619 |
| Decile 9 | 0.00044102 |
| Decile 8 | 0.000426722 |
| Decile 7 | 0.000417403 |
| Decile 6 | 0.000409624 |
| Median | 0.000402696 |
| Decile 4 | 0.000395999 |
| Decile 3 | 0.000388963 |
| Decile 2 | 0.000381037 |
| Decile 1 | 0.000370331 |
| Minimum | 0 |
|
|
- Mean = 0.000404528
- Std.dev = 2.96939e-05
- 31 items below graph minimum of 0.000299641
- 208 items above graph maximum of 0.00051171
|
2 Instances
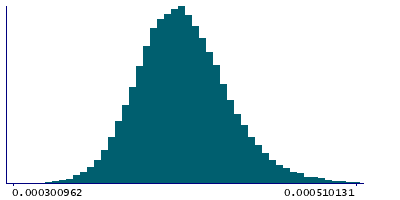
Instance 2 : Imaging visit (2014+)
79,151 participants, 79,151 items
| Maximum | 0.000699619 |
| Decile 9 | 0.000441195 |
| Decile 8 | 0.000426851 |
| Decile 7 | 0.000417527 |
| Decile 6 | 0.000409779 |
| Median | 0.000402799 |
| Decile 4 | 0.000396117 |
| Decile 3 | 0.000389032 |
| Decile 2 | 0.000381108 |
| Decile 1 | 0.000370343 |
| Minimum | 0 |
|
|
- Mean = 0.000404645
- Std.dev = 2.97182e-05
- 28 items below graph minimum of 0.000299492
- 199 items above graph maximum of 0.000512046
|
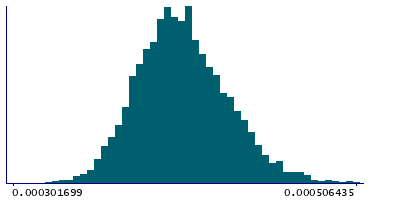
Instance 3 : First repeat imaging visit (2019+)
4,758 participants, 4,758 items
| Maximum | 0.000592645 |
| Decile 9 | 0.000438222 |
| Decile 8 | 0.000424914 |
| Decile 7 | 0.00041523 |
| Decile 6 | 0.000407303 |
| Median | 0.000400891 |
| Decile 4 | 0.000394362 |
| Decile 3 | 0.000387724 |
| Decile 2 | 0.00037978 |
| Decile 1 | 0.000369941 |
| Minimum | 0 |
|
|
- Mean = 0.000402571
- Std.dev = 2.9218e-05
- 3 items below graph minimum of 0.00030166
- 8 items above graph maximum of 0.000506503
|
Notes
Weighted-mean L3 in tract left corticospinal tract (from dMRI data)
0 Related Data-Fields
There are no related data-fields
2 Applications
| Application ID | Title |
|---|
| 17689 | Genetic, environmental and lifestyle predictors of brain/cognitive-related outcomes. |
| 22783 | The joint analysis of imaging data and genetic data for early tumor detection, prevention, diagnosis and treatment |

