Data
83,909 items of data are available, covering 79,382 participants.
Defined-instances run from 2 to 3, labelled using Instancing
2.
Units of measurement are AU.
| Maximum | 0.00108312 |
| Decile 9 | 0.000453171 |
| Decile 8 | 0.000439675 |
| Decile 7 | 0.000430471 |
| Decile 6 | 0.000422723 |
| Median | 0.000415865 |
| Decile 4 | 0.000409126 |
| Decile 3 | 0.000402106 |
| Decile 2 | 0.000394095 |
| Decile 1 | 0.000383395 |
| Minimum | 0 |
|
|
- Mean = 0.000417397
- Std.dev = 2.94832e-05
- 33 items below graph minimum of 0.000313618
- 214 items above graph maximum of 0.000522948
|
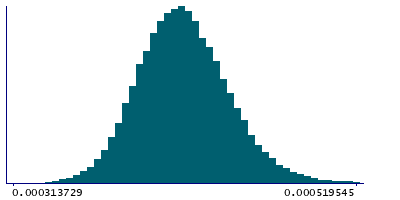
2 Instances
Instance 2 : Imaging visit (2014+)
79,151 participants, 79,151 items
| Maximum | 0.00108312 |
| Decile 9 | 0.00045328 |
| Decile 8 | 0.000439726 |
| Decile 7 | 0.000430488 |
| Decile 6 | 0.000422749 |
| Median | 0.000415912 |
| Decile 4 | 0.000409142 |
| Decile 3 | 0.000402104 |
| Decile 2 | 0.000394078 |
| Decile 1 | 0.000383371 |
| Minimum | 0 |
|

|
- Mean = 0.000417443
- Std.dev = 2.95163e-05
- 30 items below graph minimum of 0.000313462
- 200 items above graph maximum of 0.00052319
|
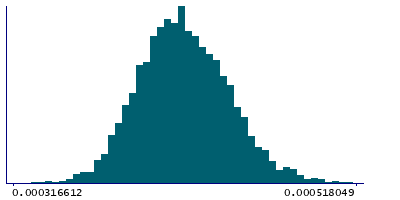
Instance 3 : First repeat imaging visit (2019+)
4,758 participants, 4,758 items
| Maximum | 0.000611884 |
| Decile 9 | 0.000450904 |
| Decile 8 | 0.00043898 |
| Decile 7 | 0.000430202 |
| Decile 6 | 0.000422239 |
| Median | 0.000415318 |
| Decile 4 | 0.000408825 |
| Decile 3 | 0.000402141 |
| Decile 2 | 0.000394382 |
| Decile 1 | 0.000383733 |
| Minimum | 0 |
|
|
- Mean = 0.000416633
- Std.dev = 2.89173e-05
- 3 items below graph minimum of 0.000316562
- 11 items above graph maximum of 0.000518074
|
Notes
Weighted-mean L3 in tract right corticospinal tract (from dMRI data)
0 Related Data-Fields
There are no related data-fields
2 Applications
| Application ID | Title |
|---|
| 17689 | Genetic, environmental and lifestyle predictors of brain/cognitive-related outcomes. |
| 22783 | The joint analysis of imaging data and genetic data for early tumor detection, prevention, diagnosis and treatment |

