Data
83,909 items of data are available, covering 79,382 participants.
Defined-instances run from 2 to 3, labelled using Instancing
2.
Units of measurement are AU.
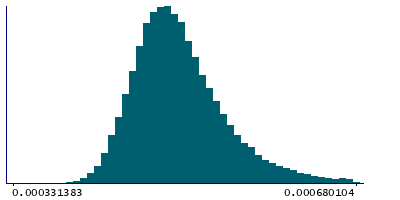
| Maximum | 0.00114138 |
| Decile 9 | 0.000565806 |
| Decile 8 | 0.000536173 |
| Decile 7 | 0.000518091 |
| Decile 6 | 0.000504692 |
| Median | 0.000493453 |
| Decile 4 | 0.00048312 |
| Decile 3 | 0.000472685 |
| Decile 2 | 0.00046151 |
| Decile 1 | 0.000446831 |
| Minimum | 0 |
|

|
- Mean = 0.000501634
- Std.dev = 5.19904e-05
- 21 items below graph minimum of 0.000327856
- 587 items above graph maximum of 0.000684781
|
2 Instances
Instance 2 : Imaging visit (2014+)
79,151 participants, 79,151 items
| Maximum | 0.00114138 |
| Decile 9 | 0.000566565 |
| Decile 8 | 0.000536798 |
| Decile 7 | 0.000518689 |
| Decile 6 | 0.000505187 |
| Median | 0.00049389 |
| Decile 4 | 0.000483542 |
| Decile 3 | 0.000473043 |
| Decile 2 | 0.000461825 |
| Decile 1 | 0.000447012 |
| Minimum | 0 |
|
|
- Mean = 0.000502115
- Std.dev = 5.21877e-05
- 19 items below graph minimum of 0.000327459
- 554 items above graph maximum of 0.000686117
|
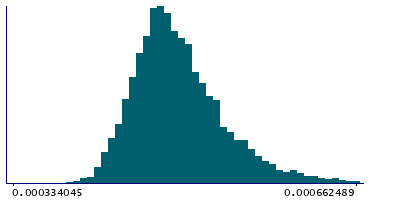
Instance 3 : First repeat imaging visit (2019+)
4,758 participants, 4,758 items
| Maximum | 0.000838079 |
| Decile 9 | 0.000553011 |
| Decile 8 | 0.000525337 |
| Decile 7 | 0.000508595 |
| Decile 6 | 0.000496929 |
| Median | 0.000485935 |
| Decile 4 | 0.000476621 |
| Decile 3 | 0.000468012 |
| Decile 2 | 0.000457576 |
| Decile 1 | 0.000443515 |
| Minimum | 0 |
|
|
- Mean = 0.000493647
- Std.dev = 4.78894e-05
- 2 items below graph minimum of 0.000334019
- 33 items above graph maximum of 0.000662507
|
Notes
Weighted-mean L3 in tract left posterior thalamic radiation (from dMRI data)
0 Related Data-Fields
There are no related data-fields
2 Applications
| Application ID | Title |
|---|
| 17689 | Genetic, environmental and lifestyle predictors of brain/cognitive-related outcomes. |
| 22783 | The joint analysis of imaging data and genetic data for early tumor detection, prevention, diagnosis and treatment |

