Data
83,905 items of data are available, covering 79,378 participants.
Defined-instances run from 2 to 3, labelled using Instancing
2.
Units of measurement are AU.
| Maximum | 0.989886 |
| Decile 9 | 0.568099 |
| Decile 8 | 0.555827 |
| Decile 7 | 0.546465 |
| Decile 6 | 0.538467 |
| Median | 0.530789 |
| Decile 4 | 0.522807 |
| Decile 3 | 0.514049 |
| Decile 2 | 0.503378 |
| Decile 1 | 0.487912 |
| Minimum | 0 |
|
|
- Mean = 0.528991
- Std.dev = 0.0338929
- 114 items below graph minimum of 0.407724
- 28 items above graph maximum of 0.648287
|
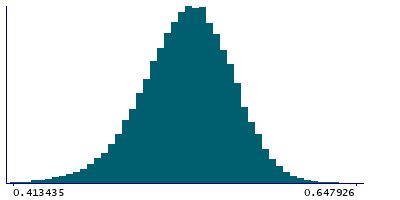
2 Instances
Instance 2 : Imaging visit (2014+)
79,147 participants, 79,147 items
| Maximum | 0.989886 |
| Decile 9 | 0.567964 |
| Decile 8 | 0.555661 |
| Decile 7 | 0.546311 |
| Decile 6 | 0.538283 |
| Median | 0.530537 |
| Decile 4 | 0.522534 |
| Decile 3 | 0.513743 |
| Decile 2 | 0.503022 |
| Decile 1 | 0.487435 |
| Minimum | 0 |
|

|
- Mean = 0.528759
- Std.dev = 0.033949
- 105 items below graph minimum of 0.406905
- 28 items above graph maximum of 0.648494
|
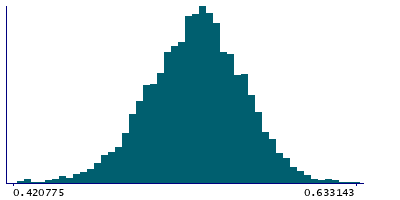
Instance 3 : First repeat imaging visit (2019+)
4,758 participants, 4,758 items
| Maximum | 0.633143 |
| Decile 9 | 0.569822 |
| Decile 8 | 0.557987 |
| Decile 7 | 0.54858 |
| Decile 6 | 0.541345 |
| Median | 0.534443 |
| Decile 4 | 0.527428 |
| Decile 3 | 0.518779 |
| Decile 2 | 0.508586 |
| Decile 1 | 0.495296 |
| Minimum | 0 |
|
|
- Mean = 0.532846
- Std.dev = 0.0327056
- 9 items below graph minimum of 0.42077
|
Notes
Weighted-mean ICVF (intra-cellular volume fraction) in tract right anterior thalamic radiation (from dMRI data)
0 Related Data-Fields
There are no related data-fields
2 Applications
| Application ID | Title |
|---|
| 17689 | Genetic, environmental and lifestyle predictors of brain/cognitive-related outcomes. |
| 22783 | The joint analysis of imaging data and genetic data for early tumor detection, prevention, diagnosis and treatment |

