Data
83,905 items of data are available, covering 79,378 participants.
Defined-instances run from 2 to 3, labelled using Instancing
2.
Units of measurement are AU.
| Maximum | 0.99 |
| Decile 9 | 0.582977 |
| Decile 8 | 0.567352 |
| Decile 7 | 0.556302 |
| Decile 6 | 0.547021 |
| Median | 0.538417 |
| Decile 4 | 0.529851 |
| Decile 3 | 0.520719 |
| Decile 2 | 0.510338 |
| Decile 1 | 0.49572 |
| Minimum | 0 |
|
|
- Mean = 0.538815
- Std.dev = 0.0359226
- 36 items below graph minimum of 0.408463
- 32 items above graph maximum of 0.670233
|
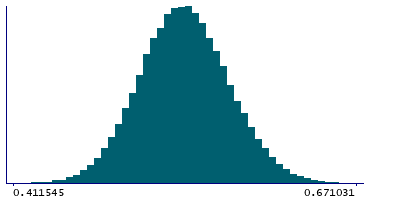
2 Instances
Instance 2 : Imaging visit (2014+)
79,147 participants, 79,147 items
| Maximum | 0.99 |
| Decile 9 | 0.582836 |
| Decile 8 | 0.567135 |
| Decile 7 | 0.556097 |
| Decile 6 | 0.546824 |
| Median | 0.538196 |
| Decile 4 | 0.529599 |
| Decile 3 | 0.520416 |
| Decile 2 | 0.509998 |
| Decile 1 | 0.495454 |
| Minimum | 0 |
|

|
- Mean = 0.538598
- Std.dev = 0.0359357
- 33 items below graph minimum of 0.408072
- 32 items above graph maximum of 0.670218
|
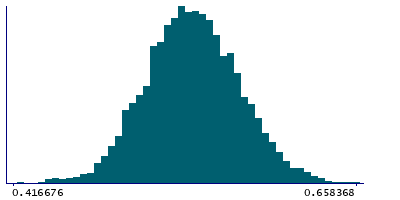
Instance 3 : First repeat imaging visit (2019+)
4,758 participants, 4,758 items
| Maximum | 0.658368 |
| Decile 9 | 0.58496 |
| Decile 8 | 0.570292 |
| Decile 7 | 0.559445 |
| Decile 6 | 0.550462 |
| Median | 0.542309 |
| Decile 4 | 0.534172 |
| Decile 3 | 0.525434 |
| Decile 2 | 0.515655 |
| Decile 1 | 0.500817 |
| Minimum | 0 |
|
|
- Mean = 0.542426
- Std.dev = 0.0355111
- 3 items below graph minimum of 0.416674
|
Notes
Weighted-mean ICVF (intra-cellular volume fraction) in tract right cingulate gyrus part of cingulum (from dMRI data)
0 Related Data-Fields
There are no related data-fields
2 Applications
| Application ID | Title |
|---|
| 17689 | Genetic, environmental and lifestyle predictors of brain/cognitive-related outcomes. |
| 22783 | The joint analysis of imaging data and genetic data for early tumor detection, prevention, diagnosis and treatment |

