Data
83,905 items of data are available, covering 79,378 participants.
Defined-instances run from 2 to 3, labelled using Instancing
2.
Units of measurement are AU.
| Maximum | 0.988838 |
| Decile 9 | 0.487047 |
| Decile 8 | 0.47487 |
| Decile 7 | 0.466543 |
| Decile 6 | 0.459609 |
| Median | 0.453311 |
| Decile 4 | 0.447139 |
| Decile 3 | 0.440453 |
| Decile 2 | 0.432642 |
| Decile 1 | 0.421496 |
| Minimum | 0 |
|
|
- Mean = 0.453887
- Std.dev = 0.0283426
- 62 items below graph minimum of 0.355944
- 80 items above graph maximum of 0.552598
|
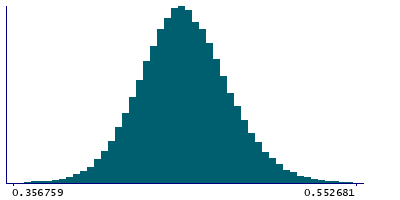
2 Instances
Instance 2 : Imaging visit (2014+)
79,147 participants, 79,147 items
| Maximum | 0.988838 |
| Decile 9 | 0.486885 |
| Decile 8 | 0.474721 |
| Decile 7 | 0.466383 |
| Decile 6 | 0.459403 |
| Median | 0.453103 |
| Decile 4 | 0.446934 |
| Decile 3 | 0.440229 |
| Decile 2 | 0.432385 |
| Decile 1 | 0.421309 |
| Minimum | 0 |
|

|
- Mean = 0.45371
- Std.dev = 0.0283795
- 58 items below graph minimum of 0.355734
- 78 items above graph maximum of 0.55246
|
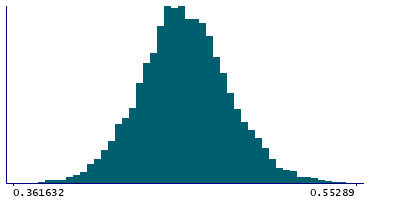
Instance 3 : First repeat imaging visit (2019+)
4,758 participants, 4,758 items
| Maximum | 0.56188 |
| Decile 9 | 0.489146 |
| Decile 8 | 0.477254 |
| Decile 7 | 0.469418 |
| Decile 6 | 0.462731 |
| Median | 0.456486 |
| Decile 4 | 0.450343 |
| Decile 3 | 0.444388 |
| Decile 2 | 0.436697 |
| Decile 1 | 0.425361 |
| Minimum | 0 |
|
|
- Mean = 0.456819
- Std.dev = 0.0275576
- 6 items below graph minimum of 0.361576
- 2 items above graph maximum of 0.552931
|
Notes
Weighted-mean ICVF (intra-cellular volume fraction) in tract right parahippocampal part of cingulum (from dMRI data)
0 Related Data-Fields
There are no related data-fields
2 Applications
| Application ID | Title |
|---|
| 17689 | Genetic, environmental and lifestyle predictors of brain/cognitive-related outcomes. |
| 22783 | The joint analysis of imaging data and genetic data for early tumor detection, prevention, diagnosis and treatment |

