Data
83,905 items of data are available, covering 79,378 participants.
Defined-instances run from 2 to 3, labelled using Instancing
2.
Units of measurement are AU.
| Maximum | 0.987921 |
| Decile 9 | 0.580857 |
| Decile 8 | 0.565718 |
| Decile 7 | 0.554629 |
| Decile 6 | 0.544858 |
| Median | 0.535815 |
| Decile 4 | 0.526606 |
| Decile 3 | 0.516425 |
| Decile 2 | 0.504449 |
| Decile 1 | 0.487464 |
| Minimum | 0 |
|

|
- Mean = 0.534833
- Std.dev = 0.0382739
- 49 items below graph minimum of 0.394072
- 47 items above graph maximum of 0.674249
|
2 Instances
Instance 2 : Imaging visit (2014+)
79,147 participants, 79,147 items
| Maximum | 0.987921 |
| Decile 9 | 0.580735 |
| Decile 8 | 0.565538 |
| Decile 7 | 0.554482 |
| Decile 6 | 0.544654 |
| Median | 0.535604 |
| Decile 4 | 0.526271 |
| Decile 3 | 0.516126 |
| Decile 2 | 0.504171 |
| Decile 1 | 0.487087 |
| Minimum | 0 |
|

|
- Mean = 0.53458
- Std.dev = 0.0383901
- 43 items below graph minimum of 0.39344
- 45 items above graph maximum of 0.674382
|
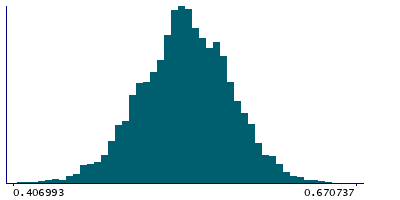
Instance 3 : First repeat imaging visit (2019+)
4,758 participants, 4,758 items
| Maximum | 0.882953 |
| Decile 9 | 0.582864 |
| Decile 8 | 0.5683 |
| Decile 7 | 0.557679 |
| Decile 6 | 0.547815 |
| Median | 0.539475 |
| Decile 4 | 0.531303 |
| Decile 3 | 0.522398 |
| Decile 2 | 0.509947 |
| Decile 1 | 0.494901 |
| Minimum | 0 |
|
|
- Mean = 0.539041
- Std.dev = 0.0360279
- 2 items below graph minimum of 0.406938
- 2 items above graph maximum of 0.670827
|
Notes
Weighted-mean ICVF (intra-cellular volume fraction) in tract forceps minor (from dMRI data)
0 Related Data-Fields
There are no related data-fields
2 Applications
| Application ID | Title |
|---|
| 17689 | Genetic, environmental and lifestyle predictors of brain/cognitive-related outcomes. |
| 22783 | The joint analysis of imaging data and genetic data for early tumor detection, prevention, diagnosis and treatment |

