Data
83,905 items of data are available, covering 79,378 participants.
Defined-instances run from 2 to 3, labelled using Instancing
2.
Units of measurement are AU.
| Maximum | 0.98971 |
| Decile 9 | 0.565422 |
| Decile 8 | 0.551634 |
| Decile 7 | 0.541444 |
| Decile 6 | 0.53281 |
| Median | 0.52436 |
| Decile 4 | 0.515867 |
| Decile 3 | 0.506581 |
| Decile 2 | 0.495242 |
| Decile 1 | 0.478903 |
| Minimum | 0 |
|

|
- Mean = 0.522953
- Std.dev = 0.0359227
- 87 items below graph minimum of 0.392383
- 21 items above graph maximum of 0.651941
|
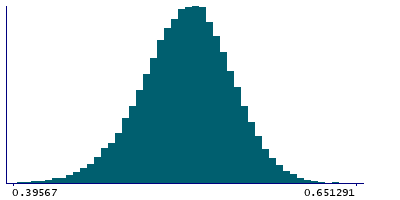
2 Instances
Instance 2 : Imaging visit (2014+)
79,147 participants, 79,147 items
| Maximum | 0.98971 |
| Decile 9 | 0.565217 |
| Decile 8 | 0.551357 |
| Decile 7 | 0.541201 |
| Decile 6 | 0.532533 |
| Median | 0.524058 |
| Decile 4 | 0.515501 |
| Decile 3 | 0.506153 |
| Decile 2 | 0.49486 |
| Decile 1 | 0.478497 |
| Minimum | 0 |
|
|
- Mean = 0.522633
- Std.dev = 0.0359834
- 83 items below graph minimum of 0.391778
- 20 items above graph maximum of 0.651936
|
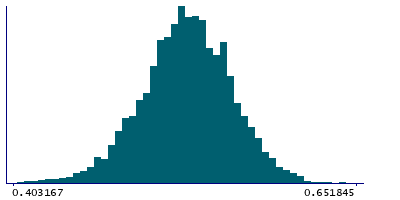
Instance 3 : First repeat imaging visit (2019+)
4,758 participants, 4,758 items
| Maximum | 0.750702 |
| Decile 9 | 0.568966 |
| Decile 8 | 0.555609 |
| Decile 7 | 0.545536 |
| Decile 6 | 0.537122 |
| Median | 0.529226 |
| Decile 4 | 0.521505 |
| Decile 3 | 0.512501 |
| Decile 2 | 0.502701 |
| Decile 1 | 0.486049 |
| Minimum | 0 |
|
|
- Mean = 0.528278
- Std.dev = 0.0344645
- 4 items below graph minimum of 0.403131
- 1 item above graph maximum of 0.651884
|
Notes
Weighted-mean ICVF (intra-cellular volume fraction) in tract left inferior fronto-occipital fasciculus (from dMRI data)
0 Related Data-Fields
There are no related data-fields
2 Applications
| Application ID | Title |
|---|
| 17689 | Genetic, environmental and lifestyle predictors of brain/cognitive-related outcomes. |
| 22783 | The joint analysis of imaging data and genetic data for early tumor detection, prevention, diagnosis and treatment |

