Data
83,905 items of data are available, covering 79,378 participants.
Defined-instances run from 2 to 3, labelled using Instancing
2.
Units of measurement are AU.
| Maximum | 0.988848 |
| Decile 9 | 0.554892 |
| Decile 8 | 0.541679 |
| Decile 7 | 0.532089 |
| Decile 6 | 0.523702 |
| Median | 0.51578 |
| Decile 4 | 0.507637 |
| Decile 3 | 0.498845 |
| Decile 2 | 0.488193 |
| Decile 1 | 0.472539 |
| Minimum | 0 |
|
|
- Mean = 0.514534
- Std.dev = 0.0340118
- 117 items below graph minimum of 0.390186
- 34 items above graph maximum of 0.637245
|
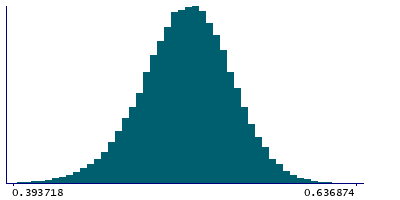
2 Instances
Instance 2 : Imaging visit (2014+)
79,147 participants, 79,147 items
| Maximum | 0.988848 |
| Decile 9 | 0.554741 |
| Decile 8 | 0.541478 |
| Decile 7 | 0.531887 |
| Decile 6 | 0.523407 |
| Median | 0.515503 |
| Decile 4 | 0.507315 |
| Decile 3 | 0.498446 |
| Decile 2 | 0.487849 |
| Decile 1 | 0.472125 |
| Minimum | 0 |
|

|
- Mean = 0.514244
- Std.dev = 0.0341047
- 114 items below graph minimum of 0.389509
- 32 items above graph maximum of 0.637358
|
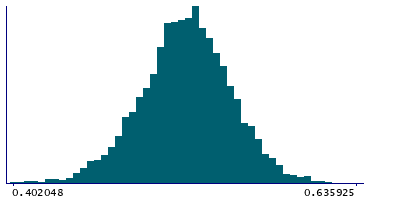
Instance 3 : First repeat imaging visit (2019+)
4,758 participants, 4,758 items
| Maximum | 0.725936 |
| Decile 9 | 0.557978 |
| Decile 8 | 0.544681 |
| Decile 7 | 0.535411 |
| Decile 6 | 0.527453 |
| Median | 0.520371 |
| Decile 4 | 0.512679 |
| Decile 3 | 0.505015 |
| Decile 2 | 0.494841 |
| Decile 1 | 0.480004 |
| Minimum | 0 |
|
|
- Mean = 0.519371
- Std.dev = 0.0320434
- 6 items below graph minimum of 0.402029
- 2 items above graph maximum of 0.635953
|
Notes
Weighted-mean ICVF (intra-cellular volume fraction) in tract right inferior longitudinal fasciculus (from dMRI data)
0 Related Data-Fields
There are no related data-fields
2 Applications
| Application ID | Title |
|---|
| 17689 | Genetic, environmental and lifestyle predictors of brain/cognitive-related outcomes. |
| 22783 | The joint analysis of imaging data and genetic data for early tumor detection, prevention, diagnosis and treatment |

