Data
83,905 items of data are available, covering 79,378 participants.
Defined-instances run from 2 to 3, labelled using Instancing
2.
Units of measurement are AU.
| Maximum | 0.986547 |
| Decile 9 | 0.63258 |
| Decile 8 | 0.622836 |
| Decile 7 | 0.616044 |
| Decile 6 | 0.610279 |
| Median | 0.605086 |
| Decile 4 | 0.599878 |
| Decile 3 | 0.594308 |
| Decile 2 | 0.587891 |
| Decile 1 | 0.579127 |
| Minimum | 0 |
|

|
- Mean = 0.605602
- Std.dev = 0.0228752
- 28 items below graph minimum of 0.525674
- 107 items above graph maximum of 0.686033
|
2 Instances
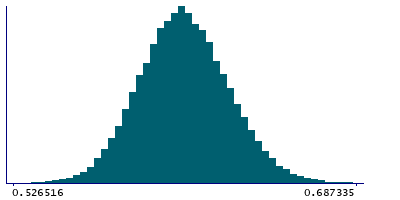
Instance 2 : Imaging visit (2014+)
79,147 participants, 79,147 items
| Maximum | 0.986547 |
| Decile 9 | 0.632141 |
| Decile 8 | 0.622459 |
| Decile 7 | 0.615649 |
| Decile 6 | 0.609883 |
| Median | 0.604676 |
| Decile 4 | 0.599496 |
| Decile 3 | 0.594001 |
| Decile 2 | 0.587559 |
| Decile 1 | 0.578813 |
| Minimum | 0 |
|
|
- Mean = 0.605251
- Std.dev = 0.0227816
- 27 items below graph minimum of 0.525486
- 101 items above graph maximum of 0.685468
|
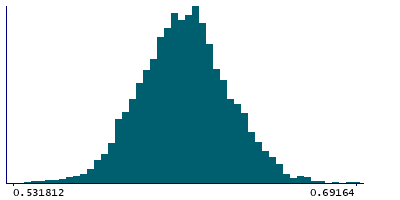
Instance 3 : First repeat imaging visit (2019+)
4,758 participants, 4,758 items
| Maximum | 0.981508 |
| Decile 9 | 0.638365 |
| Decile 8 | 0.628701 |
| Decile 7 | 0.621591 |
| Decile 6 | 0.616408 |
| Median | 0.611404 |
| Decile 4 | 0.606295 |
| Decile 3 | 0.600733 |
| Decile 2 | 0.594069 |
| Decile 1 | 0.585086 |
| Minimum | 0 |
|
|
- Mean = 0.611436
- Std.dev = 0.0236283
- 2 items below graph minimum of 0.531806
- 4 items above graph maximum of 0.691645
|
Notes
Weighted-mean ICVF (intra-cellular volume fraction) in tract left medial lemniscus (from dMRI data)
0 Related Data-Fields
There are no related data-fields
2 Applications
| Application ID | Title |
|---|
| 17689 | Genetic, environmental and lifestyle predictors of brain/cognitive-related outcomes. |
| 22783 | The joint analysis of imaging data and genetic data for early tumor detection, prevention, diagnosis and treatment |

