Data
83,905 items of data are available, covering 79,378 participants.
Defined-instances run from 2 to 3, labelled using Instancing
2.
Units of measurement are AU.
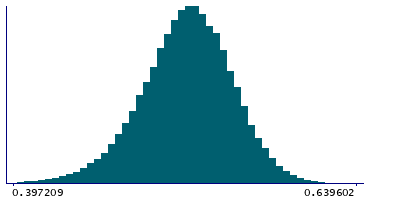
| Maximum | 0.989086 |
| Decile 9 | 0.55779 |
| Decile 8 | 0.544956 |
| Decile 7 | 0.535509 |
| Decile 6 | 0.527255 |
| Median | 0.519322 |
| Decile 4 | 0.511292 |
| Decile 3 | 0.502393 |
| Decile 2 | 0.491419 |
| Decile 1 | 0.475074 |
| Minimum | 0 |
|
|
- Mean = 0.5175
- Std.dev = 0.0349697
- 172 items below graph minimum of 0.392358
- 30 items above graph maximum of 0.640507
|
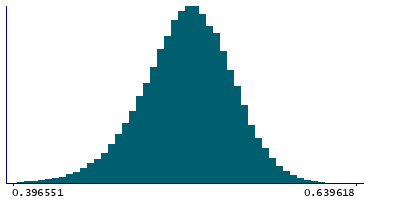
2 Instances
Instance 2 : Imaging visit (2014+)
79,147 participants, 79,147 items
| Maximum | 0.989086 |
| Decile 9 | 0.557593 |
| Decile 8 | 0.544754 |
| Decile 7 | 0.535261 |
| Decile 6 | 0.526978 |
| Median | 0.519055 |
| Decile 4 | 0.510975 |
| Decile 3 | 0.502067 |
| Decile 2 | 0.49103 |
| Decile 1 | 0.474583 |
| Minimum | 0 |
|
|
- Mean = 0.517215
- Std.dev = 0.0350203
- 157 items below graph minimum of 0.391572
- 30 items above graph maximum of 0.640604
|
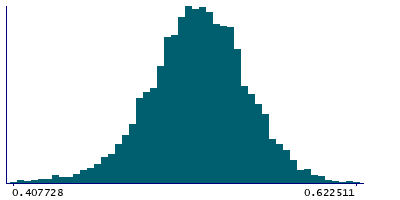
Instance 3 : First repeat imaging visit (2019+)
4,758 participants, 4,758 items
| Maximum | 0.622511 |
| Decile 9 | 0.560986 |
| Decile 8 | 0.547364 |
| Decile 7 | 0.539116 |
| Decile 6 | 0.531164 |
| Median | 0.523627 |
| Decile 4 | 0.516088 |
| Decile 3 | 0.507998 |
| Decile 2 | 0.498701 |
| Decile 1 | 0.48433 |
| Minimum | 0 |
|
|
- Mean = 0.522252
- Std.dev = 0.0337638
- 11 items below graph minimum of 0.407675
|
Notes
Weighted-mean ICVF (intra-cellular volume fraction) in tract right posterior thalamic radiation (from dMRI data)
0 Related Data-Fields
There are no related data-fields
2 Applications
| Application ID | Title |
|---|
| 17689 | Genetic, environmental and lifestyle predictors of brain/cognitive-related outcomes. |
| 22783 | The joint analysis of imaging data and genetic data for early tumor detection, prevention, diagnosis and treatment |

