Data
83,905 items of data are available, covering 79,378 participants.
Defined-instances run from 2 to 3, labelled using Instancing
2.
Units of measurement are AU.
| Maximum | 0.99 |
| Decile 9 | 0.63548 |
| Decile 8 | 0.624342 |
| Decile 7 | 0.616357 |
| Decile 6 | 0.609362 |
| Median | 0.602642 |
| Decile 4 | 0.595747 |
| Decile 3 | 0.58797 |
| Decile 2 | 0.578475 |
| Decile 1 | 0.564472 |
| Minimum | 0 |
|
|
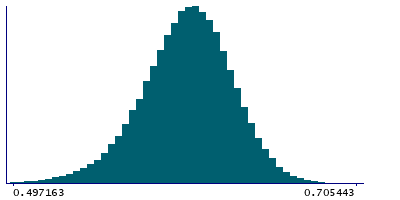
- Mean = 0.600842
- Std.dev = 0.0303398
- 258 items below graph minimum of 0.493464
- 40 items above graph maximum of 0.706489
|
2 Instances
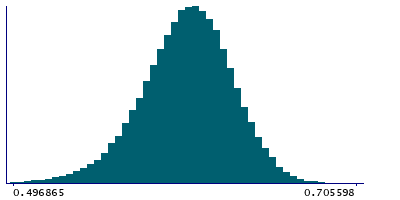
Instance 2 : Imaging visit (2014+)
79,147 participants, 79,147 items
| Maximum | 0.99 |
| Decile 9 | 0.635449 |
| Decile 8 | 0.6243 |
| Decile 7 | 0.616326 |
| Decile 6 | 0.6093 |
| Median | 0.602555 |
| Decile 4 | 0.595609 |
| Decile 3 | 0.58782 |
| Decile 2 | 0.57827 |
| Decile 1 | 0.56418 |
| Minimum | 0 |
|
|
- Mean = 0.600721
- Std.dev = 0.0304477
- 244 items below graph minimum of 0.492912
- 36 items above graph maximum of 0.706717
|
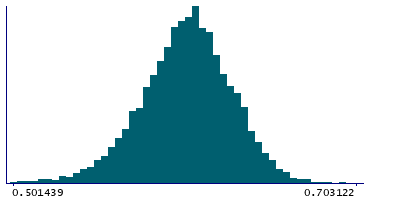
Instance 3 : First repeat imaging visit (2019+)
4,758 participants, 4,758 items
| Maximum | 0.946164 |
| Decile 9 | 0.635909 |
| Decile 8 | 0.625054 |
| Decile 7 | 0.616714 |
| Decile 6 | 0.610066 |
| Median | 0.604143 |
| Decile 4 | 0.597797 |
| Decile 3 | 0.590686 |
| Decile 2 | 0.581649 |
| Decile 1 | 0.568659 |
| Minimum | 0.367884 |
|
|
- Mean = 0.602852
- Std.dev = 0.0284107
- 13 items below graph minimum of 0.501409
- 3 items above graph maximum of 0.703159
|
Notes
Weighted-mean ICVF (intra-cellular volume fraction) in tract left superior thalamic radiation (from dMRI data)
0 Related Data-Fields
There are no related data-fields
2 Applications
| Application ID | Title |
|---|
| 17689 | Genetic, environmental and lifestyle predictors of brain/cognitive-related outcomes. |
| 22783 | The joint analysis of imaging data and genetic data for early tumor detection, prevention, diagnosis and treatment |

