Data
83,905 items of data are available, covering 79,378 participants.
Defined-instances run from 2 to 3, labelled using Instancing
2.
Units of measurement are AU.
| Maximum | 0.99 |
| Decile 9 | 0.636065 |
| Decile 8 | 0.625329 |
| Decile 7 | 0.617292 |
| Decile 6 | 0.610284 |
| Median | 0.603643 |
| Decile 4 | 0.596715 |
| Decile 3 | 0.589055 |
| Decile 2 | 0.57959 |
| Decile 1 | 0.565655 |
| Minimum | 0 |
|
|
- Mean = 0.601757
- Std.dev = 0.030409
- 278 items below graph minimum of 0.495244
- 39 items above graph maximum of 0.706476
|
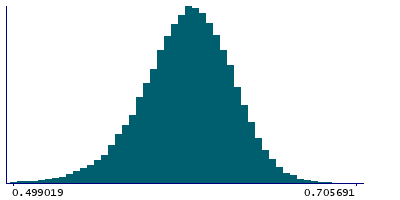
2 Instances
Instance 2 : Imaging visit (2014+)
79,147 participants, 79,147 items
| Maximum | 0.99 |
| Decile 9 | 0.636109 |
| Decile 8 | 0.625298 |
| Decile 7 | 0.617252 |
| Decile 6 | 0.610236 |
| Median | 0.60354 |
| Decile 4 | 0.59661 |
| Decile 3 | 0.58892 |
| Decile 2 | 0.579397 |
| Decile 1 | 0.565398 |
| Minimum | 0 |
|

|
- Mean = 0.601641
- Std.dev = 0.0305477
- 265 items below graph minimum of 0.494688
- 35 items above graph maximum of 0.706819
|
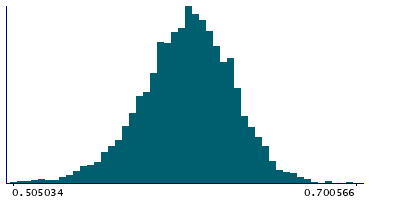
Instance 3 : First repeat imaging visit (2019+)
4,758 participants, 4,758 items
| Maximum | 0.984426 |
| Decile 9 | 0.635389 |
| Decile 8 | 0.625703 |
| Decile 7 | 0.617751 |
| Decile 6 | 0.611163 |
| Median | 0.605001 |
| Decile 4 | 0.598429 |
| Decile 3 | 0.591274 |
| Decile 2 | 0.583098 |
| Decile 1 | 0.57018 |
| Minimum | 0.396465 |
|
|
- Mean = 0.603686
- Std.dev = 0.0279306
- 11 items below graph minimum of 0.50497
- 3 items above graph maximum of 0.700599
|
Notes
Weighted-mean ICVF (intra-cellular volume fraction) in tract right superior thalamic radiation (from dMRI data)
0 Related Data-Fields
There are no related data-fields
2 Applications
| Application ID | Title |
|---|
| 17689 | Genetic, environmental and lifestyle predictors of brain/cognitive-related outcomes. |
| 22783 | The joint analysis of imaging data and genetic data for early tumor detection, prevention, diagnosis and treatment |

