Data
83,905 items of data are available, covering 79,378 participants.
Defined-instances run from 2 to 3, labelled using Instancing
2.
Units of measurement are AU.
| Maximum | 0.252266 |
| Decile 9 | 0.175719 |
| Decile 8 | 0.169089 |
| Decile 7 | 0.164371 |
| Decile 6 | 0.160422 |
| Median | 0.156894 |
| Decile 4 | 0.153322 |
| Decile 3 | 0.149483 |
| Decile 2 | 0.145116 |
| Decile 1 | 0.13935 |
| Minimum | 0 |
|

|
- Mean = 0.157231
- Std.dev = 0.0145769
- 29 items below graph minimum of 0.102981
- 51 items above graph maximum of 0.212088
|
2 Instances
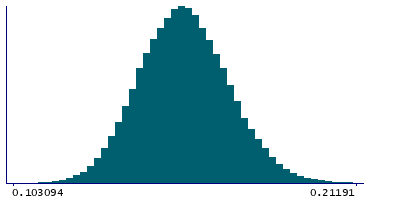
Instance 2 : Imaging visit (2014+)
79,147 participants, 79,147 items
| Maximum | 0.252266 |
| Decile 9 | 0.175703 |
| Decile 8 | 0.169067 |
| Decile 7 | 0.164339 |
| Decile 6 | 0.160393 |
| Median | 0.156857 |
| Decile 4 | 0.1533 |
| Decile 3 | 0.149463 |
| Decile 2 | 0.145081 |
| Decile 1 | 0.139322 |
| Minimum | 0 |
|
|
- Mean = 0.157208
- Std.dev = 0.0145593
- 26 items below graph minimum of 0.102942
- 49 items above graph maximum of 0.212083
|
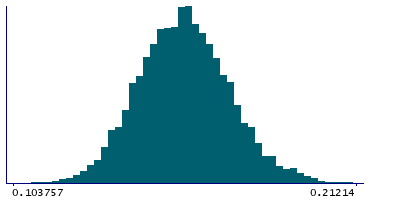
Instance 3 : First repeat imaging visit (2019+)
4,758 participants, 4,758 items
| Maximum | 0.219939 |
| Decile 9 | 0.176016 |
| Decile 8 | 0.169573 |
| Decile 7 | 0.164903 |
| Decile 6 | 0.160928 |
| Median | 0.157511 |
| Decile 4 | 0.153839 |
| Decile 3 | 0.149839 |
| Decile 2 | 0.145558 |
| Decile 1 | 0.139878 |
| Minimum | 0 |
|
|
- Mean = 0.157619
- Std.dev = 0.0148617
- 3 items below graph minimum of 0.10374
- 2 items above graph maximum of 0.212154
|
Notes
Weighted-mean OD (orientation dispersion index) in tract left corticospinal tract (from dMRI data)
0 Related Data-Fields
There are no related data-fields
2 Applications
| Application ID | Title |
|---|
| 17689 | Genetic, environmental and lifestyle predictors of brain/cognitive-related outcomes. |
| 22783 | The joint analysis of imaging data and genetic data for early tumor detection, prevention, diagnosis and treatment |

