Data
83,905 items of data are available, covering 79,378 participants.
Defined-instances run from 2 to 3, labelled using Instancing
2.
Units of measurement are AU.
| Maximum | 0.373305 |
| Decile 9 | 0.17868 |
| Decile 8 | 0.173657 |
| Decile 7 | 0.170227 |
| Decile 6 | 0.167331 |
| Median | 0.164681 |
| Decile 4 | 0.162175 |
| Decile 3 | 0.159448 |
| Decile 2 | 0.156336 |
| Decile 1 | 0.152288 |
| Minimum | 0 |
|

|
- Mean = 0.165158
- Std.dev = 0.0109011
- 23 items below graph minimum of 0.125895
- 88 items above graph maximum of 0.205073
|
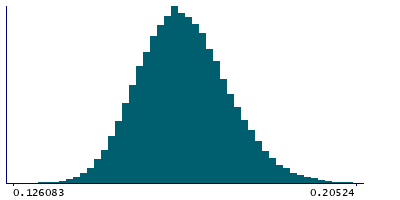
2 Instances
Instance 2 : Imaging visit (2014+)
79,147 participants, 79,147 items
| Maximum | 0.373305 |
| Decile 9 | 0.178576 |
| Decile 8 | 0.173555 |
| Decile 7 | 0.170116 |
| Decile 6 | 0.167229 |
| Median | 0.164577 |
| Decile 4 | 0.162064 |
| Decile 3 | 0.159349 |
| Decile 2 | 0.156245 |
| Decile 1 | 0.152215 |
| Minimum | 0 |
|
|
- Mean = 0.165066
- Std.dev = 0.010896
- 21 items below graph minimum of 0.125853
- 83 items above graph maximum of 0.204937
|
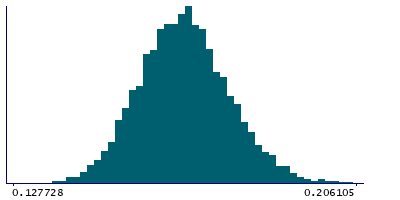
Instance 3 : First repeat imaging visit (2019+)
4,758 participants, 4,758 items
| Maximum | 0.263345 |
| Decile 9 | 0.179979 |
| Decile 8 | 0.175203 |
| Decile 7 | 0.17168 |
| Decile 6 | 0.168906 |
| Median | 0.166497 |
| Decile 4 | 0.163922 |
| Decile 3 | 0.161253 |
| Decile 2 | 0.15817 |
| Decile 1 | 0.153877 |
| Minimum | 0 |
|
|
- Mean = 0.166692
- Std.dev = 0.0108708
- 2 items below graph minimum of 0.127774
- 4 items above graph maximum of 0.206082
|
Notes
Weighted-mean OD (orientation dispersion index) in tract left inferior fronto-occipital fasciculus (from dMRI data)
0 Related Data-Fields
There are no related data-fields
2 Applications
| Application ID | Title |
|---|
| 17689 | Genetic, environmental and lifestyle predictors of brain/cognitive-related outcomes. |
| 22783 | The joint analysis of imaging data and genetic data for early tumor detection, prevention, diagnosis and treatment |

