Data
83,905 items of data are available, covering 79,378 participants.
Defined-instances run from 2 to 3, labelled using Instancing
2.
Units of measurement are AU.
| Maximum | 0.463268 |
| Decile 9 | 0.195546 |
| Decile 8 | 0.191258 |
| Decile 7 | 0.188352 |
| Decile 6 | 0.185962 |
| Median | 0.183778 |
| Decile 4 | 0.181689 |
| Decile 3 | 0.179469 |
| Decile 2 | 0.176915 |
| Decile 1 | 0.173443 |
| Minimum | 0 |
|
|
- Mean = 0.184296
- Std.dev = 0.00954451
- 17 items below graph minimum of 0.15134
- 197 items above graph maximum of 0.217649
|
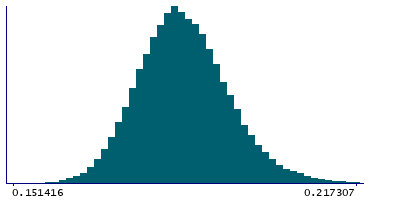
2 Instances
Instance 2 : Imaging visit (2014+)
79,147 participants, 79,147 items
| Maximum | 0.463268 |
| Decile 9 | 0.195515 |
| Decile 8 | 0.191207 |
| Decile 7 | 0.188301 |
| Decile 6 | 0.185894 |
| Median | 0.183718 |
| Decile 4 | 0.181614 |
| Decile 3 | 0.179404 |
| Decile 2 | 0.176832 |
| Decile 1 | 0.173374 |
| Minimum | 0 |
|

|
- Mean = 0.184237
- Std.dev = 0.00956046
- 17 items below graph minimum of 0.151232
- 188 items above graph maximum of 0.217656
|
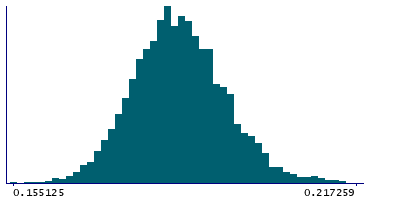
Instance 3 : First repeat imaging visit (2019+)
4,758 participants, 4,758 items
| Maximum | 0.421056 |
| Decile 9 | 0.196031 |
| Decile 8 | 0.191959 |
| Decile 7 | 0.189255 |
| Decile 6 | 0.186909 |
| Median | 0.184926 |
| Decile 4 | 0.182808 |
| Decile 3 | 0.180734 |
| Decile 2 | 0.178193 |
| Decile 1 | 0.174783 |
| Minimum | 0.155125 |
|
|
- Mean = 0.185278
- Std.dev = 0.00921997
- 9 items above graph maximum of 0.217279
|
Notes
Weighted-mean OD (orientation dispersion index) in tract left inferior longitudinal fasciculus (from dMRI data)
0 Related Data-Fields
There are no related data-fields
2 Applications
| Application ID | Title |
|---|
| 17689 | Genetic, environmental and lifestyle predictors of brain/cognitive-related outcomes. |
| 22783 | The joint analysis of imaging data and genetic data for early tumor detection, prevention, diagnosis and treatment |

