Data
83,905 items of data are available, covering 79,378 participants.
Defined-instances run from 2 to 3, labelled using Instancing
2.
Units of measurement are AU.
| Maximum | 0.432342 |
| Decile 9 | 0.198611 |
| Decile 8 | 0.193785 |
| Decile 7 | 0.190448 |
| Decile 6 | 0.187636 |
| Median | 0.185144 |
| Decile 4 | 0.18265 |
| Decile 3 | 0.180012 |
| Decile 2 | 0.176983 |
| Decile 1 | 0.172876 |
| Minimum | 0 |
|
|
- Mean = 0.185509
- Std.dev = 0.010828
- 27 items below graph minimum of 0.147142
- 133 items above graph maximum of 0.224345
|
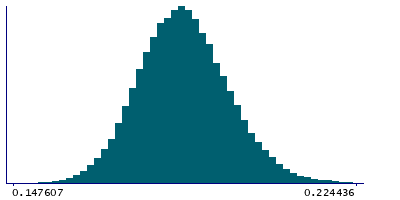
2 Instances
Instance 2 : Imaging visit (2014+)
79,147 participants, 79,147 items
| Maximum | 0.432342 |
| Decile 9 | 0.198458 |
| Decile 8 | 0.193631 |
| Decile 7 | 0.190284 |
| Decile 6 | 0.187492 |
| Median | 0.185006 |
| Decile 4 | 0.182493 |
| Decile 3 | 0.179856 |
| Decile 2 | 0.176828 |
| Decile 1 | 0.172736 |
| Minimum | 0 |
|
|
- Mean = 0.185366
- Std.dev = 0.0108173
- 25 items below graph minimum of 0.147014
- 130 items above graph maximum of 0.22418
|
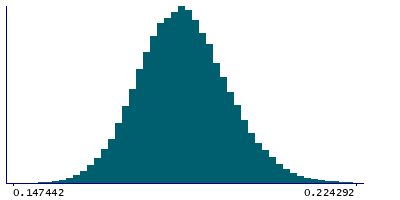
Instance 3 : First repeat imaging visit (2019+)
4,758 participants, 4,758 items
| Maximum | 0.296625 |
| Decile 9 | 0.200683 |
| Decile 8 | 0.195895 |
| Decile 7 | 0.19265 |
| Decile 6 | 0.189999 |
| Median | 0.187531 |
| Decile 4 | 0.185061 |
| Decile 3 | 0.182562 |
| Decile 2 | 0.179718 |
| Decile 1 | 0.175608 |
| Minimum | 0 |
|

|
- Mean = 0.187885
- Std.dev = 0.0107293
- 2 items below graph minimum of 0.150533
- 3 items above graph maximum of 0.225758
|
Notes
Weighted-mean OD (orientation dispersion index) in tract left posterior thalamic radiation (from dMRI data)
0 Related Data-Fields
There are no related data-fields
2 Applications
| Application ID | Title |
|---|
| 17689 | Genetic, environmental and lifestyle predictors of brain/cognitive-related outcomes. |
| 22783 | The joint analysis of imaging data and genetic data for early tumor detection, prevention, diagnosis and treatment |

