Data
83,905 items of data are available, covering 79,378 participants.
Defined-instances run from 2 to 3, labelled using Instancing
2.
Units of measurement are AU.
| Maximum | 0.636376 |
| Decile 9 | 0.246019 |
| Decile 8 | 0.240763 |
| Decile 7 | 0.23712 |
| Decile 6 | 0.234051 |
| Median | 0.231218 |
| Decile 4 | 0.228408 |
| Decile 3 | 0.225419 |
| Decile 2 | 0.221968 |
| Decile 1 | 0.217211 |
| Minimum | 0 |
|
|
- Mean = 0.231511
- Std.dev = 0.0116863
- 12 items below graph minimum of 0.188404
- 68 items above graph maximum of 0.274826
|
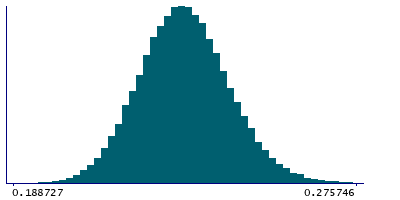
2 Instances
Instance 2 : Imaging visit (2014+)
79,147 participants, 79,147 items
| Maximum | 0.489888 |
| Decile 9 | 0.245985 |
| Decile 8 | 0.24072 |
| Decile 7 | 0.237062 |
| Decile 6 | 0.233987 |
| Median | 0.231143 |
| Decile 4 | 0.228329 |
| Decile 3 | 0.225351 |
| Decile 2 | 0.221876 |
| Decile 1 | 0.217118 |
| Minimum | 0 |
|

|
- Mean = 0.231442
- Std.dev = 0.0116322
- 12 items below graph minimum of 0.188251
- 65 items above graph maximum of 0.274852
|
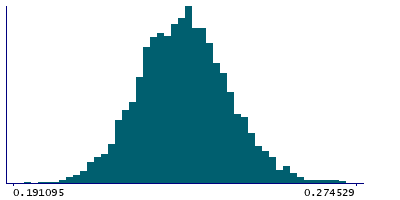
Instance 3 : First repeat imaging visit (2019+)
4,758 participants, 4,758 items
| Maximum | 0.636376 |
| Decile 9 | 0.246724 |
| Decile 8 | 0.241563 |
| Decile 7 | 0.238 |
| Decile 6 | 0.235018 |
| Median | 0.232423 |
| Decile 4 | 0.229605 |
| Decile 3 | 0.226521 |
| Decile 2 | 0.223383 |
| Decile 1 | 0.218893 |
| Minimum | 0.190272 |
|
|
- Mean = 0.232664
- Std.dev = 0.0124967
- 1 item below graph minimum of 0.191062
- 3 items above graph maximum of 0.274555
|
Notes
Weighted-mean OD (orientation dispersion index) in tract right superior longitudinal fasciculus (from dMRI data)
0 Related Data-Fields
There are no related data-fields
2 Applications
| Application ID | Title |
|---|
| 17689 | Genetic, environmental and lifestyle predictors of brain/cognitive-related outcomes. |
| 22783 | The joint analysis of imaging data and genetic data for early tumor detection, prevention, diagnosis and treatment |

