Data
83,905 items of data are available, covering 79,378 participants.
Defined-instances run from 2 to 3, labelled using Instancing
2.
Units of measurement are AU.
| Maximum | 0.593003 |
| Decile 9 | 0.266304 |
| Decile 8 | 0.260124 |
| Decile 7 | 0.255523 |
| Decile 6 | 0.251483 |
| Median | 0.247514 |
| Decile 4 | 0.243392 |
| Decile 3 | 0.23855 |
| Decile 2 | 0.232549 |
| Decile 1 | 0.223556 |
| Minimum | 0 |
|
|
- Mean = 0.245982
- Std.dev = 0.0173101
- 42 items below graph minimum of 0.180808
- 12 items above graph maximum of 0.309052
|
2 Instances
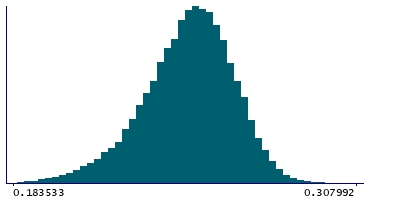
Instance 2 : Imaging visit (2014+)
79,147 participants, 79,147 items
| Maximum | 0.544697 |
| Decile 9 | 0.266244 |
| Decile 8 | 0.260021 |
| Decile 7 | 0.255434 |
| Decile 6 | 0.25138 |
| Median | 0.2474 |
| Decile 4 | 0.243261 |
| Decile 3 | 0.238426 |
| Decile 2 | 0.232434 |
| Decile 1 | 0.223402 |
| Minimum | 0 |
|

|
- Mean = 0.245861
- Std.dev = 0.0173093
- 40 items below graph minimum of 0.18056
- 10 items above graph maximum of 0.309086
|
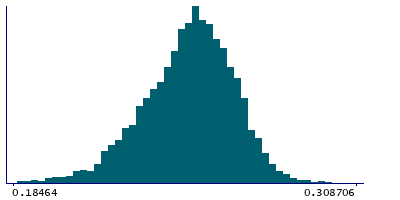
Instance 3 : First repeat imaging visit (2019+)
4,758 participants, 4,758 items
| Maximum | 0.593003 |
| Decile 9 | 0.26735 |
| Decile 8 | 0.261641 |
| Decile 7 | 0.257095 |
| Decile 6 | 0.253132 |
| Median | 0.249449 |
| Decile 4 | 0.245435 |
| Decile 3 | 0.240754 |
| Decile 2 | 0.234716 |
| Decile 1 | 0.225994 |
| Minimum | 0.179286 |
|
|
- Mean = 0.247994
- Std.dev = 0.0171979
- 4 items below graph minimum of 0.184638
- 2 items above graph maximum of 0.308707
|
Notes
Weighted-mean OD (orientation dispersion index) in tract left superior thalamic radiation (from dMRI data)
0 Related Data-Fields
There are no related data-fields
2 Applications
| Application ID | Title |
|---|
| 17689 | Genetic, environmental and lifestyle predictors of brain/cognitive-related outcomes. |
| 22783 | The joint analysis of imaging data and genetic data for early tumor detection, prevention, diagnosis and treatment |

