Data
83,905 items of data are available, covering 79,378 participants.
Defined-instances run from 2 to 3, labelled using Instancing
2.
Units of measurement are AU.
| Maximum | 0.60836 |
| Decile 9 | 0.264881 |
| Decile 8 | 0.258647 |
| Decile 7 | 0.254066 |
| Decile 6 | 0.249969 |
| Median | 0.245879 |
| Decile 4 | 0.241706 |
| Decile 3 | 0.236886 |
| Decile 2 | 0.230935 |
| Decile 1 | 0.221917 |
| Minimum | 0 |
|
|
- Mean = 0.244411
- Std.dev = 0.0175297
- 62 items below graph minimum of 0.178954
- 12 items above graph maximum of 0.307844
|
2 Instances
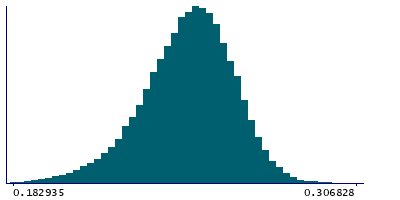
Instance 2 : Imaging visit (2014+)
79,147 participants, 79,147 items
| Maximum | 0.526563 |
| Decile 9 | 0.264821 |
| Decile 8 | 0.258581 |
| Decile 7 | 0.253962 |
| Decile 6 | 0.24985 |
| Median | 0.245744 |
| Decile 4 | 0.241591 |
| Decile 3 | 0.236756 |
| Decile 2 | 0.230784 |
| Decile 1 | 0.221752 |
| Minimum | 0 |
|
|
- Mean = 0.244276
- Std.dev = 0.0175093
- 57 items below graph minimum of 0.178683
- 9 items above graph maximum of 0.30789
|
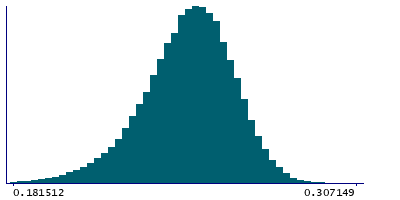
Instance 3 : First repeat imaging visit (2019+)
4,758 participants, 4,758 items
| Maximum | 0.60836 |
| Decile 9 | 0.265741 |
| Decile 8 | 0.260017 |
| Decile 7 | 0.255693 |
| Decile 6 | 0.251823 |
| Median | 0.248108 |
| Decile 4 | 0.243603 |
| Decile 3 | 0.239258 |
| Decile 2 | 0.233298 |
| Decile 1 | 0.225068 |
| Minimum | 0.177163 |
|

|
- Mean = 0.246646
- Std.dev = 0.0177169
- 5 items below graph minimum of 0.184394
- 3 items above graph maximum of 0.306414
|
Notes
Weighted-mean OD (orientation dispersion index) in tract right superior thalamic radiation (from dMRI data)
0 Related Data-Fields
There are no related data-fields
2 Applications
| Application ID | Title |
|---|
| 17689 | Genetic, environmental and lifestyle predictors of brain/cognitive-related outcomes. |
| 22783 | The joint analysis of imaging data and genetic data for early tumor detection, prevention, diagnosis and treatment |

