Data
83,905 items of data are available, covering 79,378 participants.
Defined-instances run from 2 to 3, labelled using Instancing
2.
Units of measurement are AU.
| Maximum | 0.649688 |
| Decile 9 | 0.249598 |
| Decile 8 | 0.242349 |
| Decile 7 | 0.237406 |
| Decile 6 | 0.233204 |
| Median | 0.229467 |
| Decile 4 | 0.225832 |
| Decile 3 | 0.221969 |
| Decile 2 | 0.21756 |
| Decile 1 | 0.211593 |
| Minimum | 0 |
|
|
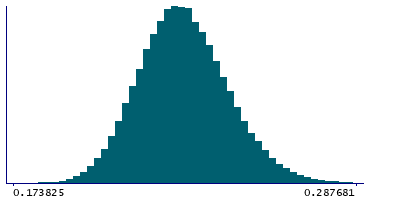
- Mean = 0.230225
- Std.dev = 0.0156964
- 11 items below graph minimum of 0.173587
- 117 items above graph maximum of 0.287603
|
2 Instances
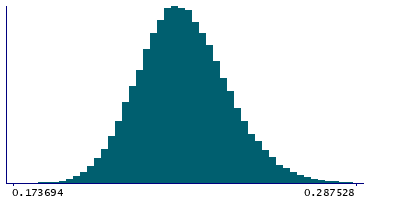
Instance 2 : Imaging visit (2014+)
79,147 participants, 79,147 items
| Maximum | 0.649688 |
| Decile 9 | 0.249484 |
| Decile 8 | 0.242227 |
| Decile 7 | 0.237267 |
| Decile 6 | 0.233076 |
| Median | 0.22932 |
| Decile 4 | 0.225674 |
| Decile 3 | 0.221842 |
| Decile 2 | 0.217422 |
| Decile 1 | 0.211454 |
| Minimum | 0 |
|
|
- Mean = 0.230091
- Std.dev = 0.0156951
- 11 items below graph minimum of 0.173425
- 113 items above graph maximum of 0.287514
|
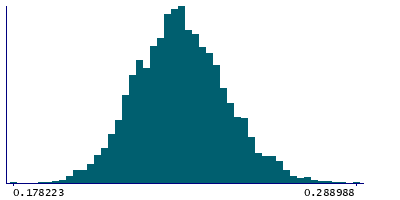
Instance 3 : First repeat imaging visit (2019+)
4,758 participants, 4,758 items
| Maximum | 0.567871 |
| Decile 9 | 0.251626 |
| Decile 8 | 0.244257 |
| Decile 7 | 0.239595 |
| Decile 6 | 0.235365 |
| Median | 0.231806 |
| Decile 4 | 0.228334 |
| Decile 3 | 0.224411 |
| Decile 2 | 0.219627 |
| Decile 1 | 0.214267 |
| Minimum | 0.178223 |
|
|
- Mean = 0.232442
- Std.dev = 0.0155513
- 5 items above graph maximum of 0.288985
|
Notes
Weighted-mean OD (orientation dispersion index) in tract right uncinate fasciculus (from dMRI data)
0 Related Data-Fields
There are no related data-fields
2 Applications
| Application ID | Title |
|---|
| 17689 | Genetic, environmental and lifestyle predictors of brain/cognitive-related outcomes. |
| 22783 | The joint analysis of imaging data and genetic data for early tumor detection, prevention, diagnosis and treatment |

