Data
86,657 items of data are available, covering 82,012 participants.
Defined-instances run from 2 to 3, labelled using Instancing
2.
Units of measurement are AU.
| Maximum | 0.908677 |
| Decile 9 | 0.724621 |
| Decile 8 | 0.698952 |
| Decile 7 | 0.682421 |
| Decile 6 | 0.669926 |
| Median | 0.659743 |
| Decile 4 | 0.650245 |
| Decile 3 | 0.640779 |
| Decile 2 | 0.630777 |
| Decile 1 | 0.618234 |
| Minimum | 0.549554 |
|
|
- Mean = 0.666422
- Std.dev = 0.0428541
- 156 items above graph maximum of 0.831008
|
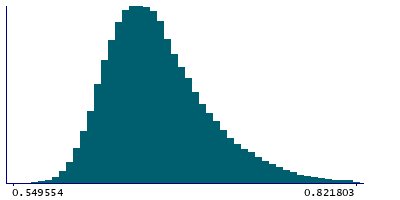
2 Instances
Instance 2 : Imaging visit (2014+)
81,876 participants, 81,876 items
| Maximum | 0.908677 |
| Decile 9 | 0.725394 |
| Decile 8 | 0.699621 |
| Decile 7 | 0.683011 |
| Decile 6 | 0.670476 |
| Median | 0.660179 |
| Decile 4 | 0.650705 |
| Decile 3 | 0.641152 |
| Decile 2 | 0.631077 |
| Decile 1 | 0.618554 |
| Minimum | 0.549554 |
|

|
- Mean = 0.666905
- Std.dev = 0.0430015
- 141 items above graph maximum of 0.832235
|
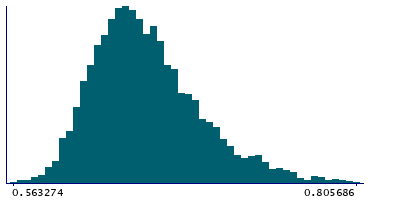
Instance 3 : First repeat imaging visit (2019+)
4,781 participants, 4,781 items
| Maximum | 0.893078 |
| Decile 9 | 0.709662 |
| Decile 8 | 0.687392 |
| Decile 7 | 0.672698 |
| Decile 6 | 0.662148 |
| Median | 0.652116 |
| Decile 4 | 0.643545 |
| Decile 3 | 0.635287 |
| Decile 2 | 0.625618 |
| Decile 1 | 0.613639 |
| Minimum | 0.563274 |
|
|
- Mean = 0.658153
- Std.dev = 0.0393372
- 17 items above graph maximum of 0.805686
|
Notes
Discrepancy between the T1 brain image (linearly-aligned to standard space) and the standard-space brain template
0 Related Data-Fields
There are no related data-fields
2 Applications
| Application ID | Title |
|---|
| 17689 | Genetic, environmental and lifestyle predictors of brain/cognitive-related outcomes. |
| 22783 | The joint analysis of imaging data and genetic data for early tumor detection, prevention, diagnosis and treatment |


