Data
86,657 items of data are available, covering 82,012 participants.
Defined-instances run from 2 to 3, labelled using Instancing
2.
Units of measurement are ratio.
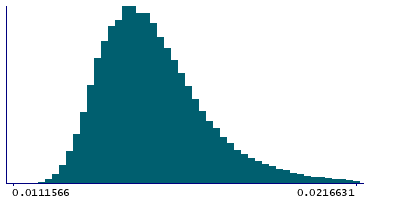
| Maximum | 0.0274989 |
| Decile 9 | 0.0177336 |
| Decile 8 | 0.0167008 |
| Decile 7 | 0.016093 |
| Decile 6 | 0.0156202 |
| Median | 0.015219 |
| Decile 4 | 0.0148477 |
| Decile 3 | 0.0144923 |
| Decile 2 | 0.014106 |
| Decile 1 | 0.0136442 |
| Minimum | 0.0111566 |
|
|
- Mean = 0.0155139
- Std.dev = 0.00173012
- 577 items above graph maximum of 0.0218231
|
2 Instances
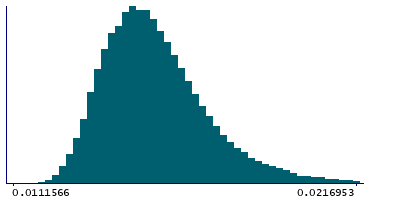
Instance 2 : Imaging visit (2014+)
81,876 participants, 81,876 items
| Maximum | 0.0274989 |
| Decile 9 | 0.0177765 |
| Decile 8 | 0.0167334 |
| Decile 7 | 0.0161197 |
| Decile 6 | 0.015647 |
| Median | 0.0152416 |
| Decile 4 | 0.0148684 |
| Decile 3 | 0.0145104 |
| Decile 2 | 0.0141206 |
| Decile 1 | 0.0136535 |
| Minimum | 0.0111566 |
|
|
- Mean = 0.0155391
- Std.dev = 0.00174333
- 540 items above graph maximum of 0.0218995
|
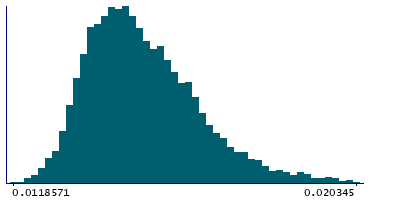
Instance 3 : First repeat imaging visit (2019+)
4,781 participants, 4,781 items
| Maximum | 0.0248716 |
| Decile 9 | 0.0169223 |
| Decile 8 | 0.0161621 |
| Decile 7 | 0.0156453 |
| Decile 6 | 0.0152363 |
| Median | 0.0148551 |
| Decile 4 | 0.0145438 |
| Decile 3 | 0.0142243 |
| Decile 2 | 0.0138879 |
| Decile 1 | 0.0134998 |
| Minimum | 0.0118571 |
|
|
- Mean = 0.0150833
- Std.dev = 0.00141815
- 15 items above graph maximum of 0.0203448
|
Notes
Inverted signal-to-noise ratio in the T1 - background spatial standard deviation divided by mean brain intensity
0 Related Data-Fields
There are no related data-fields
2 Applications
| Application ID | Title |
|---|
| 17689 | Genetic, environmental and lifestyle predictors of brain/cognitive-related outcomes. |
| 22783 | The joint analysis of imaging data and genetic data for early tumor detection, prevention, diagnosis and treatment |


