Data
77,828 items of data are available, covering 73,972 participants.
Defined-instances run from 2 to 3, labelled using Instancing
2.
Units of measurement are AU.
| Maximum | 0.983472 |
| Decile 9 | 0.461588 |
| Decile 8 | 0.437033 |
| Decile 7 | 0.421042 |
| Decile 6 | 0.408552 |
| Median | 0.397505 |
| Decile 4 | 0.386757 |
| Decile 3 | 0.375894 |
| Decile 2 | 0.363483 |
| Decile 1 | 0.347138 |
| Minimum | 0.231667 |
|

|
- Mean = 0.402359
- Std.dev = 0.0487342
- 1 item below graph minimum of 0.232688
- 447 items above graph maximum of 0.576037
|
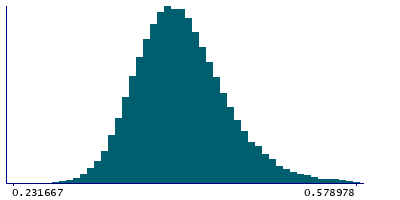
2 Instances
Instance 2 : Imaging visit (2014+)
73,188 participants, 73,188 items
| Maximum | 0.983472 |
| Decile 9 | 0.462176 |
| Decile 8 | 0.437353 |
| Decile 7 | 0.421305 |
| Decile 6 | 0.408793 |
| Median | 0.397786 |
| Decile 4 | 0.386979 |
| Decile 3 | 0.376022 |
| Decile 2 | 0.363542 |
| Decile 1 | 0.347144 |
| Minimum | 0.231667 |
|
|
- Mean = 0.4026
- Std.dev = 0.0488659
- 1 item below graph minimum of 0.232112
- 398 items above graph maximum of 0.577209
|
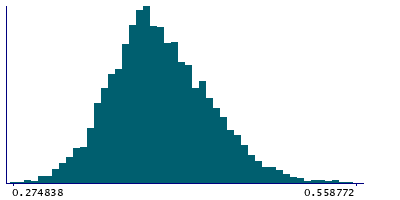
Instance 3 : First repeat imaging visit (2019+)
4,640 participants, 4,640 items
| Maximum | 0.751253 |
| Decile 9 | 0.452879 |
| Decile 8 | 0.431951 |
| Decile 7 | 0.416798 |
| Decile 6 | 0.404456 |
| Median | 0.393362 |
| Decile 4 | 0.383572 |
| Decile 3 | 0.374016 |
| Decile 2 | 0.362567 |
| Decile 1 | 0.346959 |
| Minimum | 0.274838 |
|
|
- Mean = 0.398546
- Std.dev = 0.0464418
- 45 items above graph maximum of 0.558799
|
Notes
Discrepancy between the (magnitude) SWI brain image (linearly-aligned to the T1) and the T1 brain image
0 Related Data-Fields
There are no related data-fields
2 Applications
| Application ID | Title |
|---|
| 17689 | Genetic, environmental and lifestyle predictors of brain/cognitive-related outcomes. |
| 22783 | The joint analysis of imaging data and genetic data for early tumor detection, prevention, diagnosis and treatment |


