Data
82,727 items of data are available, covering 79,343 participants.
Defined-instances run from 2 to 3, labelled using Instancing
2.
Units of measurement are slices.
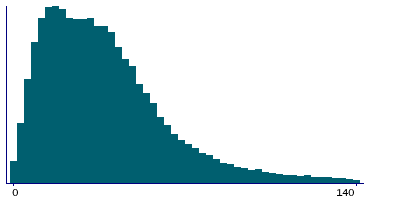
| Maximum | 519 |
| Decile 9 | 73 |
| Decile 8 | 54 |
| Decile 7 | 44 |
| Decile 6 | 36 |
| Median | 30 |
| Decile 4 | 24 |
| Decile 3 | 18 |
| Decile 2 | 14 |
| Decile 1 | 9 |
| Minimum | 0 |
|
|
- There are 342 distinct values.
- Mean = 37.4913
- Std.dev = 33.0445
- 1520 items above graph maximum of 137
|
2 Instances
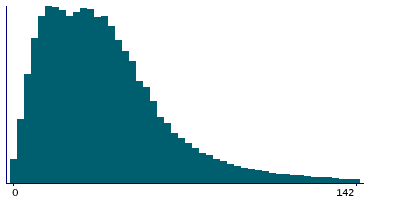
Instance 2 : Imaging visit (2014+)
79,161 participants, 79,161 items
| Maximum | 519 |
| Decile 9 | 73 |
| Decile 8 | 54 |
| Decile 7 | 44 |
| Decile 6 | 37 |
| Median | 30 |
| Decile 4 | 24 |
| Decile 3 | 18 |
| Decile 2 | 14 |
| Decile 1 | 9 |
| Minimum | 0 |
|
|
- There are 340 distinct values.
- Mean = 37.7897
- Std.dev = 33.2838
- 1495 items above graph maximum of 137
|
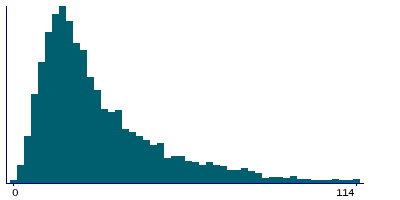
Instance 3 : First repeat imaging visit (2019+)
3,566 participants, 3,566 items
| Maximum | 352 |
| Decile 9 | 62 |
| Decile 8 | 44 |
| Decile 7 | 34 |
| Decile 6 | 28 |
| Median | 23 |
| Decile 4 | 19 |
| Decile 3 | 16 |
| Decile 2 | 13 |
| Decile 1 | 10 |
| Minimum | 0 |
|
|
- There are 152 distinct values.
- Mean = 30.8676
- Std.dev = 26.3389
- 51 items above graph maximum of 114
|
Notes
Number of dMRI outlier slices (across all slices in all volumes) detected and corrected
0 Related Data-Fields
There are no related data-fields
2 Applications
| Application ID | Title |
|---|
| 17689 | Genetic, environmental and lifestyle predictors of brain/cognitive-related outcomes. |
| 22783 | The joint analysis of imaging data and genetic data for early tumor detection, prevention, diagnosis and treatment |


