Data
85,671 items of data are available, covering 81,057 participants.
Defined-instances run from 2 to 3, labelled using Instancing
2.
Units of measurement are units.
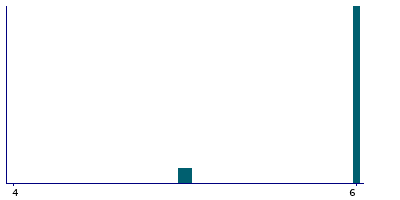
| Maximum | 6 |
| Decile 9 | 6 |
| Decile 8 | 6 |
| Decile 7 | 6 |
| Decile 6 | 6 |
| Median | 6 |
| Decile 4 | 6 |
| Decile 3 | 6 |
| Decile 2 | 6 |
| Decile 1 | 5 |
| Minimum | 1 |
|

|
- Mean = 5.86773
- Std.dev = 0.49047
- 540 items below graph minimum of 4
|
2 Instances
Instance 2 : Imaging visit (2014+)
80,901 participants, 80,901 items
| Maximum | 6 |
| Decile 9 | 6 |
| Decile 8 | 6 |
| Decile 7 | 6 |
| Decile 6 | 6 |
| Median | 6 |
| Decile 4 | 6 |
| Decile 3 | 6 |
| Decile 2 | 6 |
| Decile 1 | 5 |
| Minimum | 1 |
|
|
- Mean = 5.85995
- Std.dev = 0.503621
- 540 items below graph minimum of 4
|
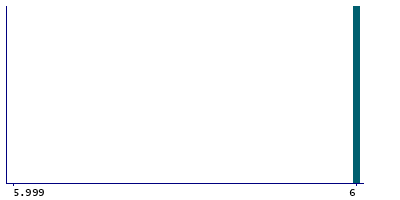
Instance 3 : First repeat imaging visit (2019+)
4,770 participants, 4,770 items
| Maximum | 6 |
| Decile 9 | 6 |
| Decile 8 | 6 |
| Decile 7 | 6 |
| Decile 6 | 6 |
| Median | 6 |
| Decile 4 | 6 |
| Decile 3 | 6 |
| Decile 2 | 6 |
| Decile 1 | 6 |
| Minimum | 5 |
|
|
- Mean = 5.99958
- Std.dev = 0.0204722
- 2 items below graph minimum of 5.999
|
Notes
Intensity scaling for T2_FLAIR
0 Related Data-Fields
There are no related data-fields
0 Resources
There are no matching Resources
