Data
457,927 items of data are available, covering 210,739 participants.
Defined-instances run from 0 to 4, labelled using Instancing
1.
Units of measurement are kj.
| Maximum | 79113.5 |
| Decile 9 | 12159.1 |
| Decile 8 | 10654.3 |
| Decile 7 | 9706.96 |
| Decile 6 | 8965.42 |
| Median | 8318.33 |
| Decile 4 | 7707.85 |
| Decile 3 | 7092 |
| Decile 2 | 6404.19 |
| Decile 1 | 5484.21 |
| Minimum | 0 |
|
|
- Mean = 8639.72
- Std.dev = 2796.14
- 2046 items above graph maximum of 18834
|
5 Instances
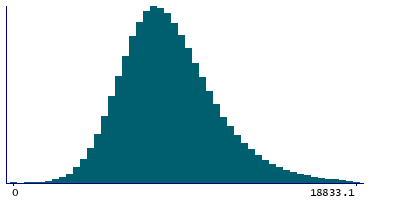
Instance 0 : Conducted in assessment centre, April 2009 to September 2010.
70,630 participants, 70,630 items
| Maximum | 79113.5 |
| Decile 9 | 12354.1 |
| Decile 8 | 10749.2 |
| Decile 7 | 9734.13 |
| Decile 6 | 8953.45 |
| Median | 8266.29 |
| Decile 4 | 7618.12 |
| Decile 3 | 6982.46 |
| Decile 2 | 6262.56 |
| Decile 1 | 5296.54 |
| Minimum | 0 |
|
|
- Mean = 8623.62
- Std.dev = 2982.99
- 365 items above graph maximum of 19411.8
|
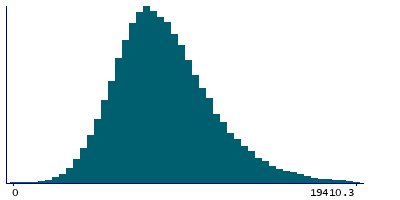
Instance 1 : On-line cycle 1, February 2011 to April 2011.
100,447 participants, 100,447 items
| Maximum | 47192.1 |
| Decile 9 | 12142.5 |
| Decile 8 | 10663.4 |
| Decile 7 | 9736.44 |
| Decile 6 | 9000.15 |
| Median | 8365.44 |
| Decile 4 | 7756.49 |
| Decile 3 | 7142.9 |
| Decile 2 | 6460.47 |
| Decile 1 | 5554.2 |
| Minimum | 0 |
|
|
- Mean = 8668.59
- Std.dev = 2740.39
- 414 items above graph maximum of 18730.8
|
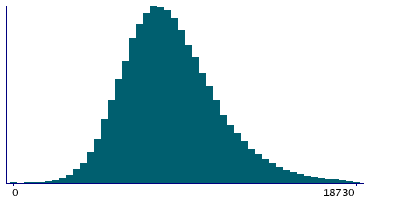
Instance 2 : On-line cycle 2, June 2011 to September 2011.
83,140 participants, 83,140 items
| Maximum | 65960.8 |
| Decile 9 | 12163 |
| Decile 8 | 10667.8 |
| Decile 7 | 9717.22 |
| Decile 6 | 8974.19 |
| Median | 8321.94 |
| Decile 4 | 7715.2 |
| Decile 3 | 7106.63 |
| Decile 2 | 6427.42 |
| Decile 1 | 5512.69 |
| Minimum | 0 |
|

|
- Mean = 8656.12
- Std.dev = 2786.69
- 354 items above graph maximum of 18813.3
|
Instance 3 : On-line cycle 3, October 2011 to December 2011.
103,616 participants, 103,616 items
| Maximum | 51221.7 |
| Decile 9 | 12039.4 |
| Decile 8 | 10562.3 |
| Decile 7 | 9629.15 |
| Decile 6 | 8902.35 |
| Median | 8275.86 |
| Decile 4 | 7673.63 |
| Decile 3 | 7057.2 |
| Decile 2 | 6380.29 |
| Decile 1 | 5476.8 |
| Minimum | 0 |
|

|
- Mean = 8577.44
- Std.dev = 2720.93
- 399 items above graph maximum of 18602.1
|
Instance 4 : On-line cycle 4, April 2012 to June 2012.
100,094 participants, 100,094 items
| Maximum | 61850.3 |
| Decile 9 | 12169.5 |
| Decile 8 | 10661.5 |
| Decile 7 | 9731.43 |
| Decile 6 | 8996.38 |
| Median | 8348.54 |
| Decile 4 | 7746.29 |
| Decile 3 | 7141.96 |
| Decile 2 | 6448.63 |
| Decile 1 | 5520.08 |
| Minimum | 0 |
|

|
- Mean = 8672.95
- Std.dev = 2798.78
- 483 items above graph maximum of 18818.9
|
