Data
457,927 items of data are available, covering 210,739 participants.
Defined-instances run from 0 to 4, labelled using Instancing
1.
Units of measurement are kj/g.
| Maximum | 24.91 |
| Decile 9 | 8.87609 |
| Decile 8 | 7.84569 |
| Decile 7 | 7.192 |
| Decile 6 | 6.67702 |
| Median | 6.22652 |
| Decile 4 | 5.80376 |
| Decile 3 | 5.38459 |
| Decile 2 | 4.92224 |
| Decile 1 | 4.32787 |
| Minimum | -1 |
|

|
- Mean = 6.46214
- Std.dev = 1.87251
- 140 items below graph minimum of -0.22035
- 1708 items above graph maximum of 13.4243
|
5 Instances
Instance 0 : Conducted in assessment centre, April 2009 to September 2010.
70,630 participants, 70,630 items
| Maximum | 24.91 |
| Decile 9 | 9.04749 |
| Decile 8 | 7.94062 |
| Decile 7 | 7.23963 |
| Decile 6 | 6.70346 |
| Median | 6.22275 |
| Decile 4 | 5.77927 |
| Decile 3 | 5.34047 |
| Decile 2 | 4.86766 |
| Decile 1 | 4.26531 |
| Minimum | -1 |
|

|
- Mean = 6.49242
- Std.dev = 1.98335
- 36 items below graph minimum of -0.516878
- 280 items above graph maximum of 13.8297
|
Instance 1 : On-line cycle 1, February 2011 to April 2011.
100,447 participants, 100,447 items
| Maximum | 24.1095 |
| Decile 9 | 8.79486 |
| Decile 8 | 7.7953 |
| Decile 7 | 7.15019 |
| Decile 6 | 6.64437 |
| Median | 6.19557 |
| Decile 4 | 5.77491 |
| Decile 3 | 5.35741 |
| Decile 2 | 4.89612 |
| Decile 1 | 4.30665 |
| Minimum | -1 |
|

|
- Mean = 6.42197
- Std.dev = 1.84376
- 28 items below graph minimum of -0.181555
- 369 items above graph maximum of 13.2831
|
Instance 2 : On-line cycle 2, June 2011 to September 2011.
83,140 participants, 83,140 items
| Maximum | 22.304 |
| Decile 9 | 8.86724 |
| Decile 8 | 7.84588 |
| Decile 7 | 7.1957 |
| Decile 6 | 6.68264 |
| Median | 6.226 |
| Decile 4 | 5.79503 |
| Decile 3 | 5.37112 |
| Decile 2 | 4.91029 |
| Decile 1 | 4.31204 |
| Minimum | -1 |
|

|
- Mean = 6.4561
- Std.dev = 1.87246
- 19 items below graph minimum of -0.243154
- 299 items above graph maximum of 13.4224
|
Instance 3 : On-line cycle 3, October 2011 to December 2011.
103,616 participants, 103,616 items
| Maximum | 23.9982 |
| Decile 9 | 8.82079 |
| Decile 8 | 7.79533 |
| Decile 7 | 7.14386 |
| Decile 6 | 6.64329 |
| Median | 6.21047 |
| Decile 4 | 5.79975 |
| Decile 3 | 5.39141 |
| Decile 2 | 4.93306 |
| Decile 1 | 4.34688 |
| Minimum | -1 |
|

|
- Mean = 6.44368
- Std.dev = 1.84558
- 22 items below graph minimum of -0.127028
- 408 items above graph maximum of 13.2947
|
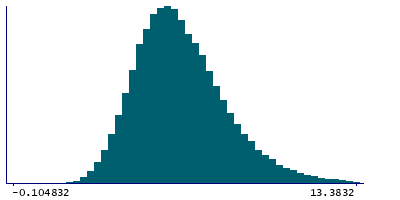
Instance 4 : On-line cycle 4, April 2012 to June 2012.
100,094 participants, 100,094 items
| Maximum | 22.1541 |
| Decile 9 | 8.8872 |
| Decile 8 | 7.88438 |
| Decile 7 | 7.24126 |
| Decile 6 | 6.72884 |
| Median | 6.27595 |
| Decile 4 | 5.86148 |
| Decile 3 | 5.44157 |
| Decile 2 | 4.98302 |
| Decile 1 | 4.39113 |
| Minimum | -1 |
|
|
- Mean = 6.5052
- Std.dev = 1.84694
- 35 items below graph minimum of -0.104938
- 350 items above graph maximum of 13.3833
|
