Data
457,927 items of data are available, covering 210,739 participants.
Defined-instances run from 0 to 4, labelled using Instancing
1.
Units of measurement are g.
| Maximum | 674.44 |
| Decile 9 | 115.68 |
| Decile 8 | 97.37 |
| Decile 7 | 85.7335 |
| Decile 6 | 76.6255 |
| Median | 68.7526 |
| Decile 4 | 61.3966 |
| Decile 3 | 54.123 |
| Decile 2 | 46.2796 |
| Decile 1 | 36.4547 |
| Minimum | 0 |
|

|
- Mean = 73.4126
- Std.dev = 32.921
- 2065 items above graph maximum of 194.906
|
5 Instances
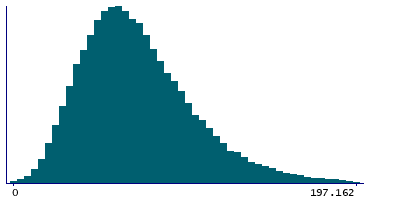
Instance 0 : Conducted in assessment centre, April 2009 to September 2010.
70,630 participants, 70,630 items
| Maximum | 584.228 |
| Decile 9 | 115.677 |
| Decile 8 | 96.6118 |
| Decile 7 | 84.4313 |
| Decile 6 | 75.0004 |
| Median | 66.9753 |
| Decile 4 | 59.544 |
| Decile 3 | 52.1802 |
| Decile 2 | 44.2044 |
| Decile 1 | 34.1861 |
| Minimum | 0 |
|
|
- Mean = 72.1059
- Std.dev = 34.1988
- 367 items above graph maximum of 197.167
|
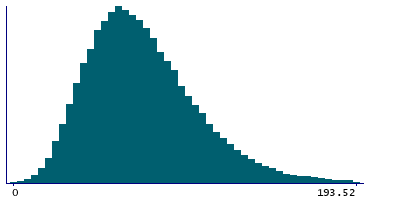
Instance 1 : On-line cycle 1, February 2011 to April 2011.
100,447 participants, 100,447 items
| Maximum | 470.934 |
| Decile 9 | 115.213 |
| Decile 8 | 97.3646 |
| Decile 7 | 85.8092 |
| Decile 6 | 76.713 |
| Median | 68.8879 |
| Decile 4 | 61.5328 |
| Decile 3 | 54.409 |
| Decile 2 | 46.6379 |
| Decile 1 | 36.8872 |
| Minimum | 0 |
|
|
- Mean = 73.4342
- Std.dev = 32.4204
- 416 items above graph maximum of 193.538
|
Instance 2 : On-line cycle 2, June 2011 to September 2011.
83,140 participants, 83,140 items
| Maximum | 674.44 |
| Decile 9 | 115.903 |
| Decile 8 | 97.5181 |
| Decile 7 | 85.9413 |
| Decile 6 | 76.8574 |
| Median | 69.0239 |
| Decile 4 | 61.6264 |
| Decile 3 | 54.327 |
| Decile 2 | 46.4482 |
| Decile 1 | 36.6244 |
| Minimum | 0 |
|

|
- Mean = 73.6369
- Std.dev = 32.9262
- 361 items above graph maximum of 195.182
|
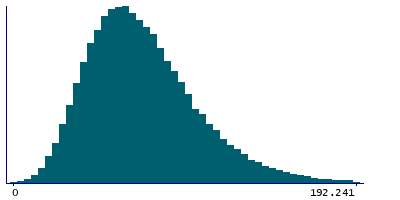
Instance 3 : On-line cycle 3, October 2011 to December 2011.
103,616 participants, 103,616 items
| Maximum | 456.628 |
| Decile 9 | 114.509 |
| Decile 8 | 96.4994 |
| Decile 7 | 85.0811 |
| Decile 6 | 76.1674 |
| Median | 68.3591 |
| Decile 4 | 61.1406 |
| Decile 3 | 53.9808 |
| Decile 2 | 46.3029 |
| Decile 1 | 36.7683 |
| Minimum | 0 |
|
|
- Mean = 72.9264
- Std.dev = 32.1184
- 437 items above graph maximum of 192.249
|
Instance 4 : On-line cycle 4, April 2012 to June 2012.
100,094 participants, 100,094 items
| Maximum | 610.28 |
| Decile 9 | 117.206 |
| Decile 8 | 98.6568 |
| Decile 7 | 86.9382 |
| Decile 6 | 77.8639 |
| Median | 70.009 |
| Decile 4 | 62.6211 |
| Decile 3 | 55.2572 |
| Decile 2 | 47.2807 |
| Decile 1 | 37.262 |
| Minimum | 0 |
|

|
- Mean = 74.6302
- Std.dev = 33.2696
- 478 items above graph maximum of 197.15
|
