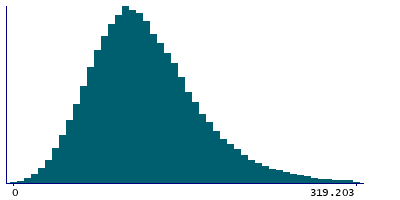
Data
457,927 items of data are available, covering 210,739 participants.
Defined-instances run from 0 to 4, labelled using Instancing
1.
Units of measurement are g.
| Maximum | 1219.51 |
| Decile 9 | 192.505 |
| Decile 8 | 163.231 |
| Decile 7 | 144.873 |
| Decile 6 | 130.491 |
| Median | 117.823 |
| Decile 4 | 105.92 |
| Decile 3 | 93.9567 |
| Decile 2 | 80.7505 |
| Decile 1 | 63.6887 |
| Minimum | 0 |
|
|
- Mean = 124.633
- Std.dev = 54.2493
- 2346 items above graph maximum of 321.322
|
5 Instances
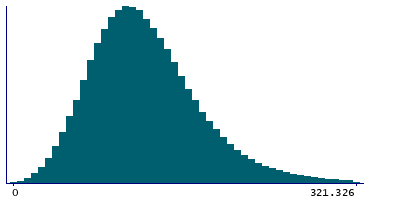
Instance 0 : Conducted in assessment centre, April 2009 to September 2010.
70,630 participants, 70,630 items
| Maximum | 1219.51 |
| Decile 9 | 198.976 |
| Decile 8 | 167.844 |
| Decile 7 | 148.244 |
| Decile 6 | 132.617 |
| Median | 119.475 |
| Decile 4 | 106.822 |
| Decile 3 | 94.2355 |
| Decile 2 | 80.3532 |
| Decile 1 | 62.6603 |
| Minimum | 0 |
|
|
- Mean = 127.17
- Std.dev = 58.7056
- 400 items above graph maximum of 335.292
|
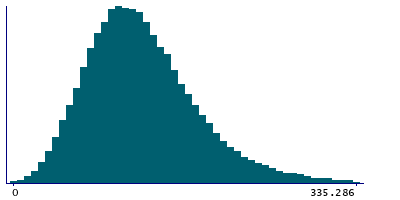
Instance 1 : On-line cycle 1, February 2011 to April 2011.
100,447 participants, 100,447 items
| Maximum | 691.533 |
| Decile 9 | 192.598 |
| Decile 8 | 163.592 |
| Decile 7 | 145.583 |
| Decile 6 | 131.395 |
| Median | 118.656 |
| Decile 4 | 107.065 |
| Decile 3 | 94.8889 |
| Decile 2 | 81.5585 |
| Decile 1 | 64.6006 |
| Minimum | 0 |
|
|
- Mean = 125.203
- Std.dev = 53.3669
- 470 items above graph maximum of 320.595
|
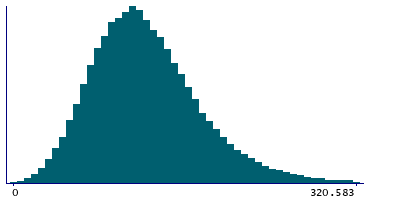
Instance 2 : On-line cycle 2, June 2011 to September 2011.
83,140 participants, 83,140 items
| Maximum | 1064.66 |
| Decile 9 | 192.712 |
| Decile 8 | 163.866 |
| Decile 7 | 145.298 |
| Decile 6 | 130.976 |
| Median | 118.274 |
| Decile 4 | 106.331 |
| Decile 3 | 94.6402 |
| Decile 2 | 81.587 |
| Decile 1 | 64.5974 |
| Minimum | 0 |
|
|
- Mean = 125.136
- Std.dev = 53.9229
- 448 items above graph maximum of 320.827
|
Instance 3 : On-line cycle 3, October 2011 to December 2011.
103,616 participants, 103,616 items
| Maximum | 807.22 |
| Decile 9 | 188.452 |
| Decile 8 | 160.155 |
| Decile 7 | 142.349 |
| Decile 6 | 128.363 |
| Median | 115.888 |
| Decile 4 | 104.03 |
| Decile 3 | 92.2127 |
| Decile 2 | 79.3622 |
| Decile 1 | 62.6159 |
| Minimum | 0 |
|

|
- Mean = 122.283
- Std.dev = 52.7059
- 517 items above graph maximum of 314.288
|
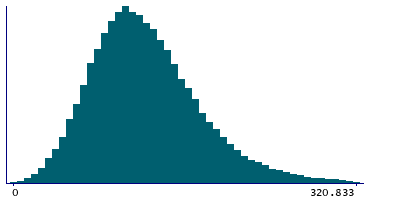
Instance 4 : On-line cycle 4, April 2012 to June 2012.
100,094 participants, 100,094 items
| Maximum | 1153.92 |
| Decile 9 | 191.563 |
| Decile 8 | 162.336 |
| Decile 7 | 144.391 |
| Decile 6 | 129.992 |
| Median | 117.564 |
| Decile 4 | 105.85 |
| Decile 3 | 94.1564 |
| Decile 2 | 81.0859 |
| Decile 1 | 63.9307 |
| Minimum | 0 |
|
|
- Mean = 124.284
- Std.dev = 53.5944
- 480 items above graph maximum of 319.195
|
