Data
457,927 items of data are available, covering 210,739 participants.
Defined-instances run from 0 to 4, labelled using Instancing
1.
Units of measurement are mg.
| Maximum | 2994.94 |
| Decile 9 | 498.609 |
| Decile 8 | 345.044 |
| Decile 7 | 268.401 |
| Decile 6 | 222.673 |
| Median | 191.472 |
| Decile 4 | 165.377 |
| Decile 3 | 140.615 |
| Decile 2 | 112.048 |
| Decile 1 | 76.3503 |
| Minimum | 0 |
|

|
- Mean = 246.313
- Std.dev = 192.974
- 6945 items above graph maximum of 920.867
|
5 Instances
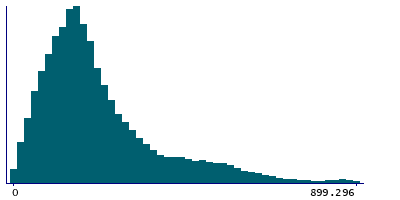
Instance 0 : Conducted in assessment centre, April 2009 to September 2010.
70,630 participants, 70,630 items
| Maximum | 2994.94 |
| Decile 9 | 484.166 |
| Decile 8 | 331.74 |
| Decile 7 | 259.096 |
| Decile 6 | 214.86 |
| Median | 184.411 |
| Decile 4 | 158.535 |
| Decile 3 | 133.377 |
| Decile 2 | 104.37 |
| Decile 1 | 69.0453 |
| Minimum | 0 |
|
|
- Mean = 237.043
- Std.dev = 189.641
- 1051 items above graph maximum of 899.287
|
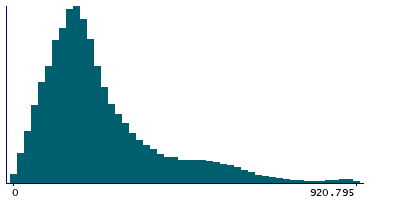
Instance 1 : On-line cycle 1, February 2011 to April 2011.
100,447 participants, 100,447 items
| Maximum | 2338.56 |
| Decile 9 | 499.294 |
| Decile 8 | 343.731 |
| Decile 7 | 268.055 |
| Decile 6 | 222.513 |
| Median | 192.176 |
| Decile 4 | 166.531 |
| Decile 3 | 142.021 |
| Decile 2 | 113.821 |
| Decile 1 | 77.7279 |
| Minimum | 0 |
|
|
- Mean = 246.719
- Std.dev = 192.19
- 1505 items above graph maximum of 920.86
|
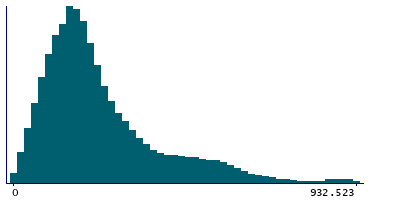
Instance 2 : On-line cycle 2, June 2011 to September 2011.
83,140 participants, 83,140 items
| Maximum | 2632.78 |
| Decile 9 | 505.403 |
| Decile 8 | 352.189 |
| Decile 7 | 273.873 |
| Decile 6 | 226.633 |
| Median | 194.182 |
| Decile 4 | 167.507 |
| Decile 3 | 142.364 |
| Decile 2 | 113.156 |
| Decile 1 | 78.372 |
| Minimum | 0 |
|
|
- Mean = 250.039
- Std.dev = 194.265
- 1202 items above graph maximum of 932.434
|
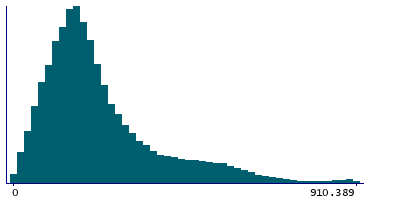
Instance 3 : On-line cycle 3, October 2011 to December 2011.
103,616 participants, 103,616 items
| Maximum | 2551.02 |
| Decile 9 | 493.528 |
| Decile 8 | 339.157 |
| Decile 7 | 263.825 |
| Decile 6 | 219.81 |
| Median | 189.789 |
| Decile 4 | 164.311 |
| Decile 3 | 140.132 |
| Decile 2 | 112.104 |
| Decile 1 | 76.5774 |
| Minimum | 0 |
|
|
- Mean = 244.228
- Std.dev = 192.23
- 1716 items above graph maximum of 910.478
|
Instance 4 : On-line cycle 4, April 2012 to June 2012.
100,094 participants, 100,094 items
| Maximum | 2571.66 |
| Decile 9 | 506.551 |
| Decile 8 | 355.621 |
| Decile 7 | 276.057 |
| Decile 6 | 227.948 |
| Median | 195.259 |
| Decile 4 | 168.572 |
| Decile 3 | 143.124 |
| Decile 2 | 114.771 |
| Decile 1 | 78.618 |
| Minimum | 0 |
|

|
- Mean = 251.51
- Std.dev = 195.5
- 1487 items above graph maximum of 934.485
|
