Data
457,927 items of data are available, covering 210,739 participants.
Defined-instances run from 0 to 4, labelled using Instancing
1.
Units of measurement are g.
| Maximum | 945.283 |
| Decile 9 | 115.459 |
| Decile 8 | 92.2624 |
| Decile 7 | 77.9019 |
| Decile 6 | 66.9479 |
| Median | 57.5319 |
| Decile 4 | 48.9333 |
| Decile 3 | 40.5293 |
| Decile 2 | 31.5932 |
| Decile 1 | 20.887 |
| Minimum | 0 |
|

|
- Mean = 64.5403
- Std.dev = 40.6674
- 3261 items above graph maximum of 210.032
|
5 Instances
Instance 0 : Conducted in assessment centre, April 2009 to September 2010.
70,630 participants, 70,630 items
| Maximum | 930.255 |
| Decile 9 | 120.105 |
| Decile 8 | 94.8996 |
| Decile 7 | 79.5151 |
| Decile 6 | 67.7752 |
| Median | 57.6474 |
| Decile 4 | 48.4648 |
| Decile 3 | 39.7522 |
| Decile 2 | 30.7993 |
| Decile 1 | 19.8826 |
| Minimum | 0 |
|
|
- Mean = 65.6996
- Std.dev = 43.7407
- 520 items above graph maximum of 220.326
|
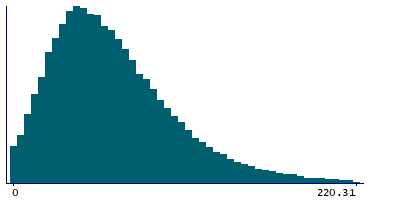
Instance 1 : On-line cycle 1, February 2011 to April 2011.
100,447 participants, 100,447 items
| Maximum | 493.986 |
| Decile 9 | 114.502 |
| Decile 8 | 91.8906 |
| Decile 7 | 77.6445 |
| Decile 6 | 66.7621 |
| Median | 57.4682 |
| Decile 4 | 49.0561 |
| Decile 3 | 40.7518 |
| Decile 2 | 31.7834 |
| Decile 1 | 21.0757 |
| Minimum | 0 |
|

|
- Mean = 64.2842
- Std.dev = 39.8586
- 670 items above graph maximum of 207.929
|
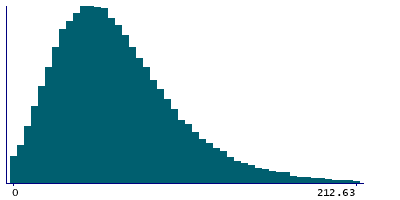
Instance 2 : On-line cycle 2, June 2011 to September 2011.
83,140 participants, 83,140 items
| Maximum | 738.784 |
| Decile 9 | 117.118 |
| Decile 8 | 93.4795 |
| Decile 7 | 79.1487 |
| Decile 6 | 68.0699 |
| Median | 58.6 |
| Decile 4 | 50.0216 |
| Decile 3 | 41.5389 |
| Decile 2 | 32.398 |
| Decile 1 | 21.6228 |
| Minimum | 0 |
|
|
- Mean = 65.581
- Std.dev = 40.7211
- 579 items above graph maximum of 212.613
|
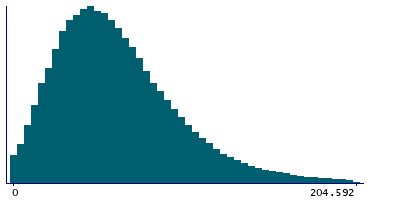
Instance 3 : On-line cycle 3, October 2011 to December 2011.
103,616 participants, 103,616 items
| Maximum | 580.124 |
| Decile 9 | 112.525 |
| Decile 8 | 90.1238 |
| Decile 7 | 75.9928 |
| Decile 6 | 65.4102 |
| Median | 56.2963 |
| Decile 4 | 47.8789 |
| Decile 3 | 39.6705 |
| Decile 2 | 30.9547 |
| Decile 1 | 20.4702 |
| Minimum | 0 |
|
|
- Mean = 63.0102
- Std.dev = 39.4325
- 737 items above graph maximum of 204.58
|
Instance 4 : On-line cycle 4, April 2012 to June 2012.
100,094 participants, 100,094 items
| Maximum | 945.283 |
| Decile 9 | 115.103 |
| Decile 8 | 92.078 |
| Decile 7 | 78.0771 |
| Decile 6 | 67.2604 |
| Median | 57.91 |
| Decile 4 | 49.3361 |
| Decile 3 | 40.9672 |
| Decile 2 | 32.0174 |
| Decile 1 | 21.3182 |
| Minimum | 0 |
|

|
- Mean = 64.6987
- Std.dev = 40.3801
- 706 items above graph maximum of 208.889
|
