Data
457,927 items of data are available, covering 210,739 participants.
Defined-instances run from 0 to 4, labelled using Instancing
1.
Units of measurement are g.
| Maximum | 126.185 |
| Decile 9 | 17.9764 |
| Decile 8 | 15.6637 |
| Decile 7 | 14.2358 |
| Decile 6 | 13.1162 |
| Median | 12.1387 |
| Decile 4 | 11.2035 |
| Decile 3 | 10.2386 |
| Decile 2 | 9.1367 |
| Decile 1 | 7.66015 |
| Minimum | 0 |
|

|
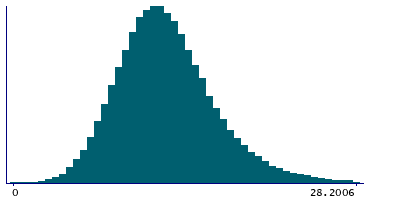
- Mean = 12.6029
- Std.dev = 4.3924
- 2515 items above graph maximum of 28.2926
|
5 Instances
Instance 0 : Conducted in assessment centre, April 2009 to September 2010.
70,630 participants, 70,630 items
| Maximum | 126.185 |
| Decile 9 | 18.1398 |
| Decile 8 | 15.7355 |
| Decile 7 | 14.2245 |
| Decile 6 | 13.0421 |
| Median | 12.0176 |
| Decile 4 | 11.056 |
| Decile 3 | 10.0595 |
| Decile 2 | 8.88526 |
| Decile 1 | 7.3312 |
| Minimum | 0 |
|

|
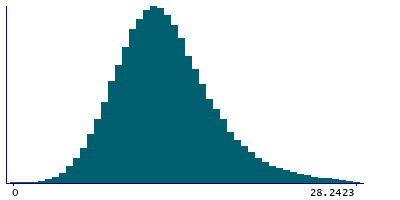
- Mean = 12.5264
- Std.dev = 4.64702
- 423 items above graph maximum of 28.9483
|
Instance 1 : On-line cycle 1, February 2011 to April 2011.
100,447 participants, 100,447 items
| Maximum | 99.2197 |
| Decile 9 | 17.9958 |
| Decile 8 | 15.7128 |
| Decile 7 | 14.3108 |
| Decile 6 | 13.2115 |
| Median | 12.2394 |
| Decile 4 | 11.3103 |
| Decile 3 | 10.3532 |
| Decile 2 | 9.25726 |
| Decile 1 | 7.79008 |
| Minimum | 0 |
|
|
- Mean = 12.6837
- Std.dev = 4.32664
- 527 items above graph maximum of 28.2015
|
Instance 2 : On-line cycle 2, June 2011 to September 2011.
83,140 participants, 83,140 items
| Maximum | 122.261 |
| Decile 9 | 17.9863 |
| Decile 8 | 15.6408 |
| Decile 7 | 14.2119 |
| Decile 6 | 13.0954 |
| Median | 12.1173 |
| Decile 4 | 11.1763 |
| Decile 3 | 10.2131 |
| Decile 2 | 9.1349 |
| Decile 1 | 7.67061 |
| Minimum | 0 |
|

|
- Mean = 12.5994
- Std.dev = 4.41773
- 497 items above graph maximum of 28.302
|
Instance 3 : On-line cycle 3, October 2011 to December 2011.
103,616 participants, 103,616 items
| Maximum | 87.2701 |
| Decile 9 | 17.8532 |
| Decile 8 | 15.5773 |
| Decile 7 | 14.1809 |
| Decile 6 | 13.0765 |
| Median | 12.1143 |
| Decile 4 | 11.1964 |
| Decile 3 | 10.248 |
| Decile 2 | 9.14993 |
| Decile 1 | 7.69342 |
| Minimum | 0 |
|

|
- Mean = 12.5541
- Std.dev = 4.26793
- 516 items above graph maximum of 28.0129
|
Instance 4 : On-line cycle 4, April 2012 to June 2012.
100,094 participants, 100,094 items
| Maximum | 106.259 |
| Decile 9 | 17.9748 |
| Decile 8 | 15.6816 |
| Decile 7 | 14.2425 |
| Decile 6 | 13.1295 |
| Median | 12.1587 |
| Decile 4 | 11.2273 |
| Decile 3 | 10.2593 |
| Decile 2 | 9.17449 |
| Decile 1 | 7.71157 |
| Minimum | 0 |
|
|
- Mean = 12.6294
- Std.dev = 4.37734
- 551 items above graph maximum of 28.238
|
