Data
457,927 items of data are available, covering 210,739 participants.
Defined-instances run from 0 to 4, labelled using Instancing
1.
Units of measurement are g.
| Maximum | 282 |
| Decile 9 | 24 |
| Decile 8 | 18 |
| Decile 7 | 15 |
| Decile 6 | 3 |
| Median | 0 |
| Decile 4 | 0 |
| Decile 3 | 0 |
| Decile 2 | 0 |
| Decile 1 | 0 |
| Minimum | 0 |
|

|
- Mean = 8.81278
- Std.dev = 14.3686
- 9742 items above graph maximum of 48
|
5 Instances
Instance 0 : Conducted in assessment centre, April 2009 to September 2010.
70,630 participants, 70,630 items
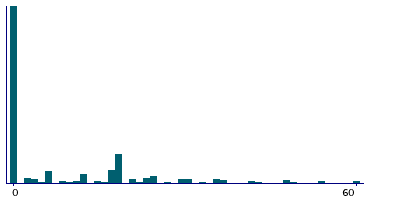
| Maximum | 282 |
| Decile 9 | 30 |
| Decile 8 | 18 |
| Decile 7 | 15 |
| Decile 6 | 3 |
| Median | 0 |
| Decile 4 | 0 |
| Decile 3 | 0 |
| Decile 2 | 0 |
| Decile 1 | 0 |
| Minimum | 0 |
|
|
- Mean = 9.69438
- Std.dev = 16.1767
- 1290 items above graph maximum of 60
|
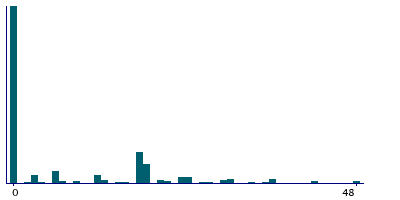
Instance 1 : On-line cycle 1, February 2011 to April 2011.
100,447 participants, 100,447 items
| Maximum | 162 |
| Decile 9 | 24 |
| Decile 8 | 18 |
| Decile 7 | 18 |
| Decile 6 | 3 |
| Median | 0 |
| Decile 4 | 0 |
| Decile 3 | 0 |
| Decile 2 | 0 |
| Decile 1 | 0 |
| Minimum | 0 |
|
|
- Mean = 8.9373
- Std.dev = 14.3793
- 2165 items above graph maximum of 48
|
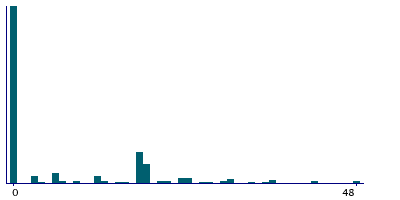
Instance 2 : On-line cycle 2, June 2011 to September 2011.
83,140 participants, 83,140 items
| Maximum | 180 |
| Decile 9 | 24 |
| Decile 8 | 18 |
| Decile 7 | 12 |
| Decile 6 | 3 |
| Median | 0 |
| Decile 4 | 0 |
| Decile 3 | 0 |
| Decile 2 | 0 |
| Decile 1 | 0 |
| Minimum | 0 |
|
|
- Mean = 8.35998
- Std.dev = 13.754
- 1520 items above graph maximum of 48
|
Instance 3 : On-line cycle 3, October 2011 to December 2011.
103,616 participants, 103,616 items
| Maximum | 186 |
| Decile 9 | 24 |
| Decile 8 | 18 |
| Decile 7 | 18 |
| Decile 6 | 3 |
| Median | 0 |
| Decile 4 | 0 |
| Decile 3 | 0 |
| Decile 2 | 0 |
| Decile 1 | 0 |
| Minimum | 0 |
|

|
- Mean = 8.79759
- Std.dev = 14.0527
- 2035 items above graph maximum of 48
|
Instance 4 : On-line cycle 4, April 2012 to June 2012.
100,094 participants, 100,094 items
| Maximum | 276 |
| Decile 9 | 24 |
| Decile 8 | 18 |
| Decile 7 | 13.5 |
| Decile 6 | 3 |
| Median | 0 |
| Decile 4 | 0 |
| Decile 3 | 0 |
| Decile 2 | 0 |
| Decile 1 | 0 |
| Minimum | 0 |
|

|
- Mean = 8.45758
- Std.dev = 13.7825
- 1846 items above graph maximum of 48
|
