Data
457,927 items of data are available, covering 210,739 participants.
Defined-instances run from 0 to 4, labelled using Instancing
1.
Units of measurement are g.
| Maximum | 1116 |
| Decile 9 | 96 |
| Decile 8 | 72 |
| Decile 7 | 30 |
| Decile 6 | 0 |
| Median | 0 |
| Decile 4 | 0 |
| Decile 3 | 0 |
| Decile 2 | 0 |
| Decile 1 | 0 |
| Minimum | 0 |
|
|
- Mean = 28.9733
- Std.dev = 53.565
- 6438 items above graph maximum of 192
|
5 Instances
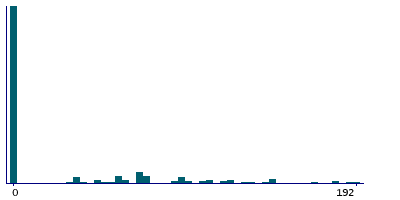
Instance 0 : Conducted in assessment centre, April 2009 to September 2010.
70,630 participants, 70,630 items
| Maximum | 956 |
| Decile 9 | 108 |
| Decile 8 | 72 |
| Decile 7 | 36 |
| Decile 6 | 0 |
| Median | 0 |
| Decile 4 | 0 |
| Decile 3 | 0 |
| Decile 2 | 0 |
| Decile 1 | 0 |
| Minimum | 0 |
|
|
- Mean = 32.8603
- Std.dev = 59.1326
- 1272 items above graph maximum of 216
|
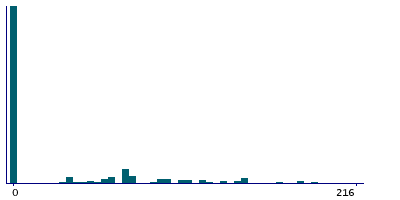
Instance 1 : On-line cycle 1, February 2011 to April 2011.
100,447 participants, 100,447 items
| Maximum | 1116 |
| Decile 9 | 95 |
| Decile 8 | 72 |
| Decile 7 | 0 |
| Decile 6 | 0 |
| Median | 0 |
| Decile 4 | 0 |
| Decile 3 | 0 |
| Decile 2 | 0 |
| Decile 1 | 0 |
| Minimum | 0 |
|

|
- Mean = 27.8886
- Std.dev = 52.0389
- 1431 items above graph maximum of 190
|
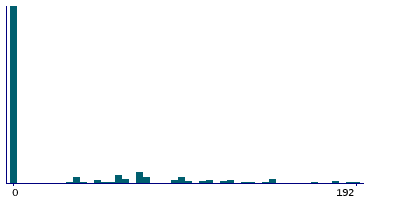
Instance 2 : On-line cycle 2, June 2011 to September 2011.
83,140 participants, 83,140 items
| Maximum | 786 |
| Decile 9 | 96 |
| Decile 8 | 72 |
| Decile 7 | 36 |
| Decile 6 | 0 |
| Median | 0 |
| Decile 4 | 0 |
| Decile 3 | 0 |
| Decile 2 | 0 |
| Decile 1 | 0 |
| Minimum | 0 |
|
|
- Mean = 29.1729
- Std.dev = 53.3861
- 1145 items above graph maximum of 192
|
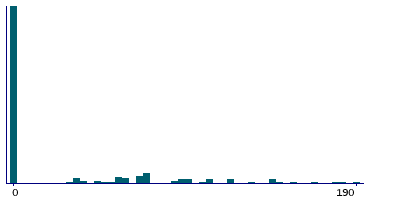
Instance 3 : On-line cycle 3, October 2011 to December 2011.
103,616 participants, 103,616 items
| Maximum | 786 |
| Decile 9 | 95 |
| Decile 8 | 72 |
| Decile 7 | 0 |
| Decile 6 | 0 |
| Median | 0 |
| Decile 4 | 0 |
| Decile 3 | 0 |
| Decile 2 | 0 |
| Decile 1 | 0 |
| Minimum | 0 |
|
|
- Mean = 27.928
- Std.dev = 51.8505
- 1453 items above graph maximum of 190
|
Instance 4 : On-line cycle 4, April 2012 to June 2012.
100,094 participants, 100,094 items
| Maximum | 786 |
| Decile 9 | 95 |
| Decile 8 | 72 |
| Decile 7 | 18 |
| Decile 6 | 0 |
| Median | 0 |
| Decile 4 | 0 |
| Decile 3 | 0 |
| Decile 2 | 0 |
| Decile 1 | 0 |
| Minimum | 0 |
|

|
- Mean = 28.2354
- Std.dev = 52.7029
- 1524 items above graph maximum of 190
|
