Data
457,926 items of data are available, covering 210,739 participants.
Defined-instances run from 0 to 4, labelled using Instancing
1.
Units of measurement are g.
| Maximum | 12.8983 |
| Decile 9 | 2.21558 |
| Decile 8 | 1.73051 |
| Decile 7 | 1.44038 |
| Decile 6 | 1.2213 |
| Median | 1.0375 |
| Decile 4 | 0.8731 |
| Decile 3 | 0.713803 |
| Decile 2 | 0.548976 |
| Decile 1 | 0.368225 |
| Minimum | 0 |
|

|
- Mean = 1.19852
- Std.dev = 0.798302
- 3377 items above graph maximum of 4.06294
|
5 Instances
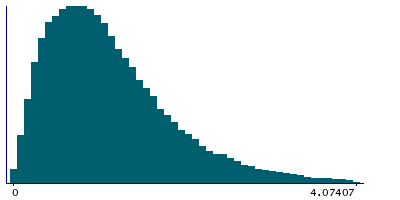
Instance 0 : Conducted in assessment centre, April 2009 to September 2010.
70,630 participants, 70,630 items
| Maximum | 12.8983 |
| Decile 9 | 2.20599 |
| Decile 8 | 1.70857 |
| Decile 7 | 1.4145 |
| Decile 6 | 1.19023 |
| Median | 1.00757 |
| Decile 4 | 0.841724 |
| Decile 3 | 0.68048 |
| Decile 2 | 0.515931 |
| Decile 1 | 0.3373 |
| Minimum | 0 |
|
|
- Mean = 1.17656
- Std.dev = 0.817818
- 584 items above graph maximum of 4.07467
|
Instance 1 : On-line cycle 1, February 2011 to April 2011.
100,447 participants, 100,447 items
| Maximum | 11.6099 |
| Decile 9 | 2.19762 |
| Decile 8 | 1.71677 |
| Decile 7 | 1.43314 |
| Decile 6 | 1.21718 |
| Median | 1.03515 |
| Decile 4 | 0.869987 |
| Decile 3 | 0.712398 |
| Decile 2 | 0.550002 |
| Decile 1 | 0.371418 |
| Minimum | 0 |
|

|
- Mean = 1.19092
- Std.dev = 0.78408
- 697 items above graph maximum of 4.02382
|
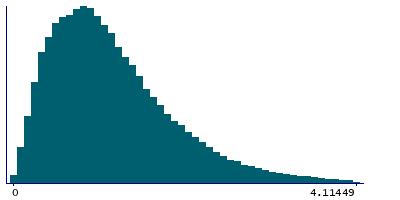
Instance 2 : On-line cycle 2, June 2011 to September 2011.
83,140 participants, 83,140 items
| Maximum | 12.8012 |
| Decile 9 | 2.24419 |
| Decile 8 | 1.76022 |
| Decile 7 | 1.46084 |
| Decile 6 | 1.23632 |
| Median | 1.05117 |
| Decile 4 | 0.885937 |
| Decile 3 | 0.726225 |
| Decile 2 | 0.556721 |
| Decile 1 | 0.373321 |
| Minimum | 0 |
|
|
- Mean = 1.21571
- Std.dev = 0.810038
- 598 items above graph maximum of 4.11507
|
Instance 3 : On-line cycle 3, October 2011 to December 2011.
103,615 participants, 103,615 items
| Maximum | 12.6603 |
| Decile 9 | 2.20205 |
| Decile 8 | 1.72114 |
| Decile 7 | 1.43166 |
| Decile 6 | 1.21656 |
| Median | 1.03458 |
| Decile 4 | 0.874003 |
| Decile 3 | 0.717238 |
| Decile 2 | 0.553603 |
| Decile 1 | 0.373798 |
| Minimum | 0 |
|

|
- Mean = 1.19439
- Std.dev = 0.787493
- 722 items above graph maximum of 4.03031
|
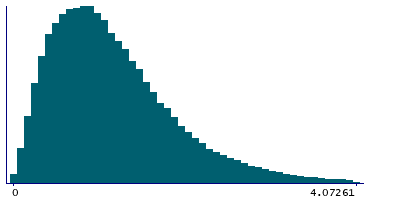
Instance 4 : On-line cycle 4, April 2012 to June 2012.
100,094 participants, 100,094 items
| Maximum | 12.2439 |
| Decile 9 | 2.22498 |
| Decile 8 | 1.74551 |
| Decile 7 | 1.4579 |
| Decile 6 | 1.23935 |
| Median | 1.05383 |
| Decile 4 | 0.887001 |
| Decile 3 | 0.725157 |
| Decile 2 | 0.56065 |
| Decile 1 | 0.3778 |
| Minimum | 0 |
|
|
- Mean = 1.21165
- Std.dev = 0.799279
- 784 items above graph maximum of 4.07216
|
