Data
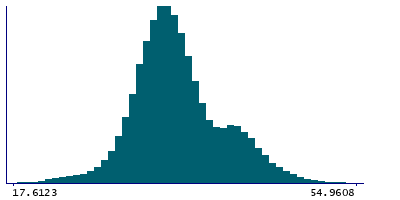
87,996 items of data are available, covering 83,313 participants.
Defined-instances run from 2 to 3, labelled using Instancing
2.
Units of measurement are AU.
| Maximum | 59.5947 |
| Decile 9 | 41.8364 |
| Decile 8 | 38.5828 |
| Decile 7 | 36.6374 |
| Decile 6 | 35.4141 |
| Median | 34.4126 |
| Decile 4 | 33.486 |
| Decile 3 | 32.5244 |
| Decile 2 | 31.4162 |
| Decile 1 | 29.752 |
| Minimum | 12.6093 |
|
|
- Mean = 34.9844
- Std.dev = 4.80529
- 21 items below graph minimum of 17.6676
- 35 items above graph maximum of 53.9208
|
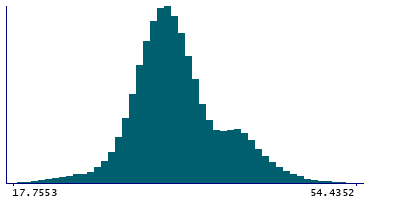
2 Instances
Instance 2 : Imaging visit (2014+)
83,241 participants, 83,241 items
| Maximum | 59.5947 |
| Decile 9 | 41.7987 |
| Decile 8 | 38.5232 |
| Decile 7 | 36.5975 |
| Decile 6 | 35.3791 |
| Median | 34.3794 |
| Decile 4 | 33.4614 |
| Decile 3 | 32.5 |
| Decile 2 | 31.3931 |
| Decile 1 | 29.7309 |
| Minimum | 12.6093 |
|
|
- Mean = 34.9543
- Std.dev = 4.79663
- 20 items below graph minimum of 17.6632
- 33 items above graph maximum of 53.8664
|
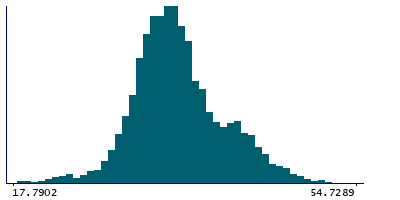
Instance 3 : First repeat imaging visit (2019+)
4,755 participants, 4,755 items
| Maximum | 56.9653 |
| Decile 9 | 42.416 |
| Decile 8 | 39.4479 |
| Decile 7 | 37.3533 |
| Decile 6 | 36.0424 |
| Median | 34.9596 |
| Decile 4 | 33.9954 |
| Decile 3 | 32.9439 |
| Decile 2 | 31.7929 |
| Decile 1 | 30.1171 |
| Minimum | 17.4235 |
|
|
- Mean = 35.5108
- Std.dev = 4.92475
- 1 item below graph minimum of 17.8183
- 2 items above graph maximum of 54.7148
|
Notes
Mean intensity of 3rd-Ventricle in the whole brain generated by subcortical volumetric segmentation (aseg)
0 Related Data-Fields
There are no related data-fields
0 Resources
There are no matching Resources
