Data
87,996 items of data are available, covering 83,313 participants.
Defined-instances run from 2 to 3, labelled using Instancing
2.
Units of measurement are AU.
| Maximum | 111.095 |
| Decile 9 | 93.4145 |
| Decile 8 | 91.8727 |
| Decile 7 | 90.6961 |
| Decile 6 | 89.6773 |
| Median | 88.7 |
| Decile 4 | 87.7073 |
| Decile 3 | 86.6051 |
| Decile 2 | 85.2522 |
| Decile 1 | 83.1709 |
| Minimum | 59.5842 |
|
|
- Mean = 88.3846
- Std.dev = 4.19295
- 320 items below graph minimum of 72.9272
- 5 items above graph maximum of 103.658
|
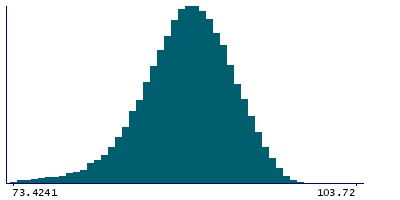
2 Instances
Instance 2 : Imaging visit (2014+)
83,241 participants, 83,241 items
| Maximum | 111.095 |
| Decile 9 | 93.3991 |
| Decile 8 | 91.8546 |
| Decile 7 | 90.6828 |
| Decile 6 | 89.6611 |
| Median | 88.6803 |
| Decile 4 | 87.6837 |
| Decile 3 | 86.5755 |
| Decile 2 | 85.2265 |
| Decile 1 | 83.1398 |
| Minimum | 59.5842 |
|

|
- Mean = 88.3621
- Std.dev = 4.20299
- 308 items below graph minimum of 72.8806
- 5 items above graph maximum of 103.658
|
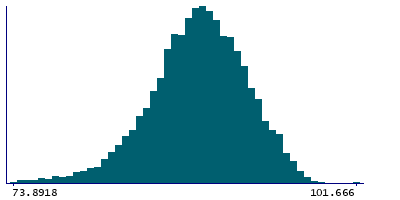
Instance 3 : First repeat imaging visit (2019+)
4,755 participants, 4,755 items
| Maximum | 101.666 |
| Decile 9 | 93.6491 |
| Decile 8 | 92.1309 |
| Decile 7 | 90.9964 |
| Decile 6 | 89.9545 |
| Median | 89.0215 |
| Decile 4 | 88.0832 |
| Decile 3 | 87.0176 |
| Decile 2 | 85.811 |
| Decile 1 | 83.775 |
| Minimum | 70.08 |
|
|
- Mean = 88.7791
- Std.dev = 3.99249
- 13 items below graph minimum of 73.901
|
Notes
Mean intensity of CC-Mid-Posterior in the whole brain generated by subcortical volumetric segmentation (aseg)
0 Related Data-Fields
There are no related data-fields
0 Resources
There are no matching Resources
