Data
87,996 items of data are available, covering 83,313 participants.
Defined-instances run from 2 to 3, labelled using Instancing
2.
Units of measurement are AU.
| Maximum | 101.788 |
| Decile 9 | 95.5144 |
| Decile 8 | 94.6613 |
| Decile 7 | 94.0036 |
| Decile 6 | 93.4142 |
| Median | 92.8345 |
| Decile 4 | 92.2137 |
| Decile 3 | 91.5115 |
| Decile 2 | 90.6299 |
| Decile 1 | 89.2946 |
| Minimum | 63.3144 |
|
|
- Mean = 92.5133
- Std.dev = 2.71751
- 692 items below graph minimum of 83.0747
- 1 item above graph maximum of 101.734
|
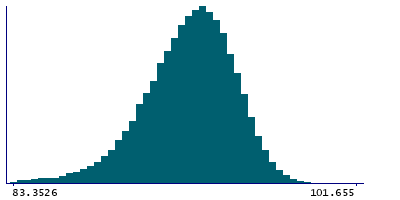
2 Instances
Instance 2 : Imaging visit (2014+)
83,241 participants, 83,241 items
| Maximum | 101.788 |
| Decile 9 | 95.5105 |
| Decile 8 | 94.6574 |
| Decile 7 | 94 |
| Decile 6 | 93.4094 |
| Median | 92.8269 |
| Decile 4 | 92.204 |
| Decile 3 | 91.501 |
| Decile 2 | 90.6162 |
| Decile 1 | 89.2751 |
| Minimum | 63.3144 |
|

|
- Mean = 92.5033
- Std.dev = 2.72656
- 657 items below graph minimum of 83.0396
- 1 item above graph maximum of 101.746
|
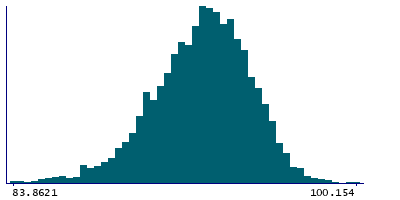
Instance 3 : First repeat imaging visit (2019+)
4,755 participants, 4,755 items
| Maximum | 100.154 |
| Decile 9 | 95.5625 |
| Decile 8 | 94.7214 |
| Decile 7 | 94.0817 |
| Decile 6 | 93.4844 |
| Median | 92.9436 |
| Decile 4 | 92.3737 |
| Decile 3 | 91.6851 |
| Decile 2 | 90.8772 |
| Decile 1 | 89.7123 |
| Minimum | 72.0775 |
|
|
- Mean = 92.6886
- Std.dev = 2.54744
- 35 items below graph minimum of 83.8621
|
Notes
Mean intensity of CC-Mid-Anterior in the whole brain generated by subcortical volumetric segmentation (aseg)
0 Related Data-Fields
There are no related data-fields
0 Resources
There are no matching Resources
