Data
87,996 items of data are available, covering 83,313 participants.
Defined-instances run from 2 to 3, labelled using Instancing
2.
Units of measurement are AU.
| Maximum | 95.2791 |
| Decile 9 | 89.6349 |
| Decile 8 | 88.8795 |
| Decile 7 | 88.3137 |
| Decile 6 | 87.8317 |
| Median | 87.3759 |
| Decile 4 | 86.9006 |
| Decile 3 | 86.3615 |
| Decile 2 | 85.6737 |
| Decile 1 | 84.7044 |
| Minimum | 51.392 |
|
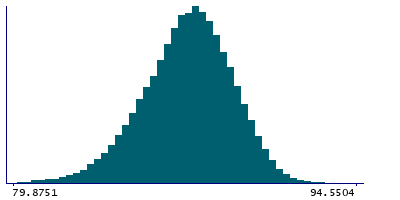
|
- Mean = 87.2346
- Std.dev = 1.99575
- 223 items below graph minimum of 79.774
- 3 items above graph maximum of 94.5653
|
2 Instances
Instance 2 : Imaging visit (2014+)
83,241 participants, 83,241 items
| Maximum | 95.2791 |
| Decile 9 | 89.6263 |
| Decile 8 | 88.8682 |
| Decile 7 | 88.3029 |
| Decile 6 | 87.8184 |
| Median | 87.3623 |
| Decile 4 | 86.8871 |
| Decile 3 | 86.3479 |
| Decile 2 | 85.6603 |
| Decile 1 | 84.6927 |
| Minimum | 51.392 |
|
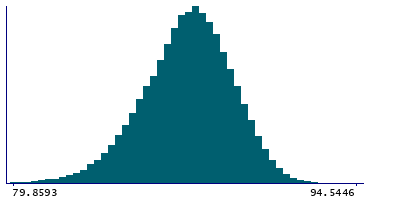
|
- Mean = 87.2223
- Std.dev = 1.99857
- 214 items below graph minimum of 79.7592
- 3 items above graph maximum of 94.5599
|
Instance 3 : First repeat imaging visit (2019+)
4,755 participants, 4,755 items
| Maximum | 93.0433 |
| Decile 9 | 89.778 |
| Decile 8 | 89.0875 |
| Decile 7 | 88.5163 |
| Decile 6 | 88.0351 |
| Median | 87.6183 |
| Decile 4 | 87.114 |
| Decile 3 | 86.6057 |
| Decile 2 | 85.9418 |
| Decile 1 | 84.9487 |
| Minimum | 74.6368 |
|
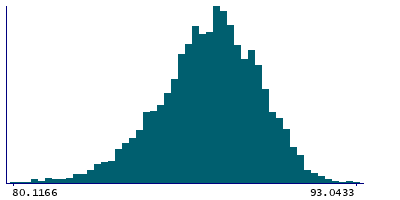
|
- Mean = 87.4501
- Std.dev = 1.93304
- 8 items below graph minimum of 80.1195
|
Notes
Mean intensity of Putamen in the left hemisphere generated by subcortical volumetric segmentation (aseg)
0 Related Data-Fields
There are no related data-fields
0 Resources
There are no matching Resources
