Data
87,996 items of data are available, covering 83,313 participants.
Defined-instances run from 2 to 3, labelled using Instancing
2.
Units of measurement are AU.
| Maximum | 93.6328 |
| Decile 9 | 72.5957 |
| Decile 8 | 71.8324 |
| Decile 7 | 71.2965 |
| Decile 6 | 70.8508 |
| Median | 70.4239 |
| Decile 4 | 69.989 |
| Decile 3 | 69.5195 |
| Decile 2 | 68.9476 |
| Decile 1 | 68.103 |
| Minimum | 52.3818 |
|

|
- Mean = 70.376
- Std.dev = 1.83918
- 123 items below graph minimum of 63.6104
- 53 items above graph maximum of 77.0883
|
2 Instances
Instance 2 : Imaging visit (2014+)
83,241 participants, 83,241 items
| Maximum | 93.6328 |
| Decile 9 | 72.6021 |
| Decile 8 | 71.8414 |
| Decile 7 | 71.3019 |
| Decile 6 | 70.8556 |
| Median | 70.4299 |
| Decile 4 | 69.9933 |
| Decile 3 | 69.5236 |
| Decile 2 | 68.9531 |
| Decile 1 | 68.1075 |
| Minimum | 52.3818 |
|

|
- Mean = 70.3813
- Std.dev = 1.84114
- 117 items below graph minimum of 63.6128
- 51 items above graph maximum of 77.0968
|
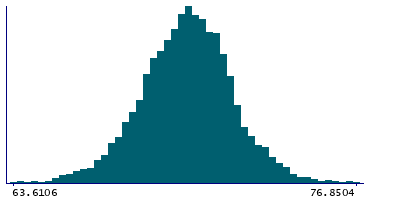
Instance 3 : First repeat imaging visit (2019+)
4,755 participants, 4,755 items
| Maximum | 77.8579 |
| Decile 9 | 72.4372 |
| Decile 8 | 71.6934 |
| Decile 7 | 71.2091 |
| Decile 6 | 70.7562 |
| Median | 70.3314 |
| Decile 4 | 69.9174 |
| Decile 3 | 69.4296 |
| Decile 2 | 68.8749 |
| Decile 1 | 68.0239 |
| Minimum | 59.1698 |
|
|
- Mean = 70.2838
- Std.dev = 1.80197
- 6 items below graph minimum of 63.6106
- 2 items above graph maximum of 76.8504
|
Notes
Mean intensity of Amygdala in the left hemisphere generated by subcortical volumetric segmentation (aseg)
0 Related Data-Fields
There are no related data-fields
0 Resources
There are no matching Resources
